CloudWatch Alarms
最后更新: September 13, 2026
本文的 CLI 与 Terraform 示例涵盖 经典 CloudWatch 指标告警(metric alarm) 和复合告警(composite alarm)。CloudWatch 还支持基于其 OTLP 端点摄取的指标的 PromQL 告警,以及基于 Logs Insights 查询结果的 日志告警。PromQL 告警使用 PendingPeriod/RecoveryPeriod;下文的 M-of-N 与缺失数据设置并不能原样套用。文中的账户、Region 和资源取值均为示例。在执行创建或更新命令之前,请先确认实际目标、IAM 权限、成本和接收人。PutMetricAlarm/PutCompositeAlarm 会替换已有的告警配置,因此更新前请先保留其当前设置。
目录
- CloudWatch Alarms 概述
- 架构
- 指标告警
- 复合告警
- 异常检测
- SNS 集成
- EventBridge 集成
- Container Insights 告警
- CloudWatch 告警动作
- 成本优化
- Prometheus 指标集成
- Terraform 示例
CloudWatch Alarms Overview
Amazon CloudWatch Alarms 是 AWS 原生监控服务的告警功能。它基于 CloudWatch 指标创建告警,并可通过与 SNS、Lambda、EC2 Auto Scaling 等服务集成实现自动化响应。
主要特性
- 指标告警(Metric Alarms):评估单个指标、指标数学表达式或 Metrics Insights 查询
- 复合告警(Composite Alarms):组合多个告警条件
- 异常检测(Anomaly Detection):基于机器学习的异常检测
- 告警动作(Alarm Actions):告警触发时执行自动动作
- AWS 服务集成:与 EC2、ECS、EKS、Lambda 等原生集成
CloudWatch Alarms 与 Prometheus Alertmanager 对比
| 特性 | CloudWatch Alarms | Prometheus Alertmanager |
|---|---|---|
| 类型 | AWS 托管服务 | 开源 |
| 数据源 | 按告警类型使用 CloudWatch 指标、OTLP 指标或日志 | 由 Prometheus 或其他客户端评估出的告警 |
| 评估方式 | 按告警类型使用指标数学、PromQL 或 Logs Insights | Prometheus 评估 PromQL;Alertmanager 负责分组、抑制和路由 |
| 成本 | 取决于告警类型、被评估的指标、查询和贡献者数量 | 无软件许可费用;但基础设施与运维仍有成本 |
| 复杂路由 | 有限 | 支持高级路由 |
| AWS 集成 | 原生 | 需要额外配置 |
Architecture
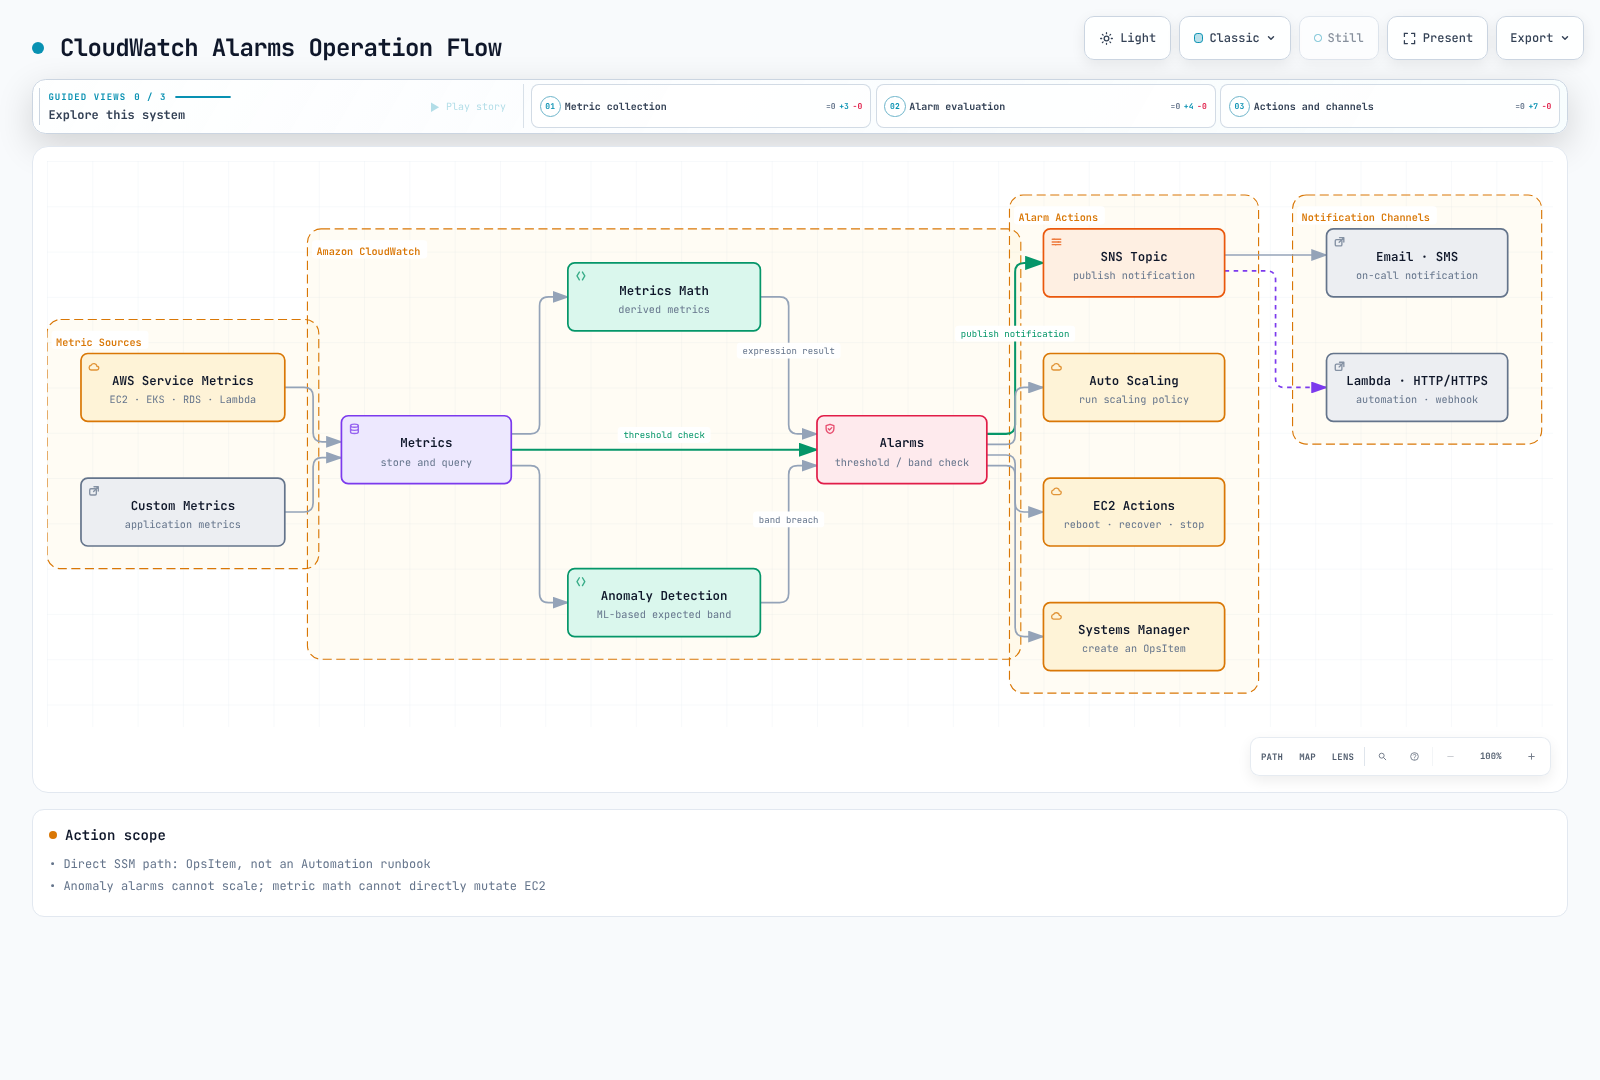
CloudWatch Alarms 运行流程
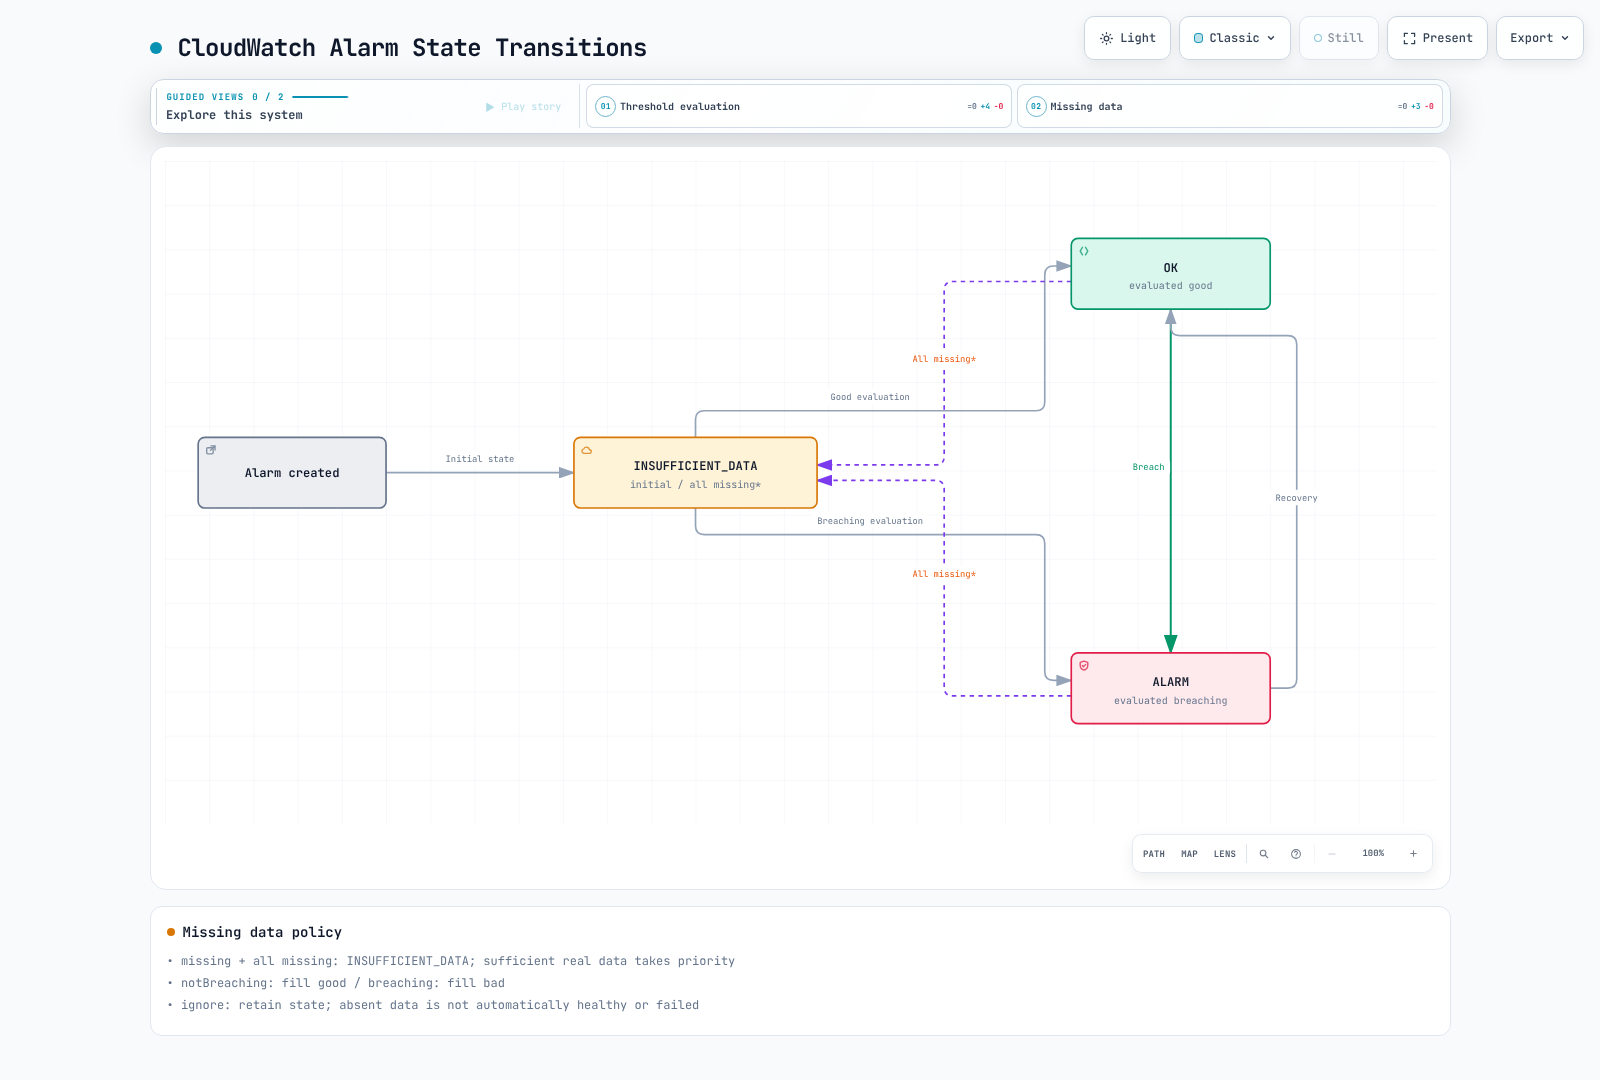
告警状态
经典指标告警从 INSUFFICIENT_DATA 开始,随后被评估为 OK 或 ALARM。缺失数据并不总是意味着 INSUFFICIENT_DATA:missing 只有在全部评估数据都缺失时才产生数据不足,notBreaching 将缺失点视为正常,breaching 将其视为异常,ignore 则保持当前状态。当其他真实数据点已足以完成评估时,CloudWatch 不会使用缺失数据填充设置。因此一律采用 notBreaching 策略可能掩盖心跳或采集器已停止的情况。复合告警只有在刚创建之后才可能处于 INSUFFICIENT_DATA 状态。
Metric Alarms
创建基础告警(控制台/CLI)
AWS CLI
# Create CPU utilization alarm
aws cloudwatch put-metric-alarm \
  --alarm-name "HighCPUUtilization" \
  --alarm-description "CPU usage exceeds 80%" \
  --metric-name CPUUtilization \
  --namespace AWS/EC2 \
  --statistic Average \
  --period 300 \
  --threshold 80 \
  --comparison-operator GreaterThanThreshold \
  --evaluation-periods 2 \
  --dimensions Name=InstanceId,Value=i-1234567890abcdef0 \
  --alarm-actions arn:aws:sns:ap-northeast-2:123456789012:alerts \
  --ok-actions arn:aws:sns:ap-northeast-2:123456789012:alerts \
  --treat-missing-data missing
告警配置要素
| 参数 | 说明 | 示例 |
|---|---|---|
metric-name | 要监控的指标名称 | CPUUtilization |
namespace | 指标命名空间 | AWS/EC2, AWS/EKS |
statistic | 统计函数 | Average, Sum, Maximum, Minimum, SampleCount |
period | 评估周期(秒) | 60, 300, 3600 |
threshold | 阈值 | 80 |
comparison-operator | 比较运算符 | GreaterThanThreshold |
evaluation-periods | 评估周期数 N | 3(M 为 datapoints-to-alarm) |
datapoints-to-alarm | 触发告警所需的数据点数 | 3 中的 2 |
treat-missing-data | 缺失数据处理方式 | notBreaching, breaching, ignore, missing |
请使用 --extended-statistic p99,而不是 --statistic p99。N 个周期中的 M 个越界数据点无需连续;省略 M 时其值等于 N。Period 是聚合时长,而不是通知间隔。经典指标告警使用 10、20 或 30 秒周期属于高分辨率,需要相应的高分辨率数据。60 秒为标准分辨率。Period×N 上限为 7 天;当 Period 小于 1 小时时上限为 1 天。除 Auto Scaling 动作外,动作通常在状态转换时执行。
比较运算符
# Available comparison operators
comparison-operators:
  - GreaterThanThreshold           # Greater than
  - GreaterThanOrEqualToThreshold  # Greater than or equal
  - LessThanThreshold              # Less than
  - LessThanOrEqualToThreshold     # Less than or equal
  - LessThanLowerOrGreaterThanUpperThreshold  # Outside range
  - LessThanLowerThreshold         # Below lower bound
  - GreaterThanUpperThreshold      # Above upper bound
使用指标数学(Metrics Math)的告警
# Error rate calculation alarm (error count / total requests)
aws cloudwatch put-metric-alarm \
  --alarm-name "HighErrorRate" \
  --alarm-description "Error rate exceeds 5%" \
  --metrics '[
    {
      "Id": "errors",
      "MetricStat": {
        "Metric": {
          "Namespace": "AWS/ApplicationELB",
          "MetricName": "HTTPCode_Target_5XX_Count",
          "Dimensions": [
            {"Name": "LoadBalancer", "Value": "app/my-alb/1234567890"}
          ]
        },
        "Period": 300,
        "Stat": "Sum"
      },
      "ReturnData": false
    },
    {
      "Id": "requests",
      "MetricStat": {
        "Metric": {
          "Namespace": "AWS/ApplicationELB",
          "MetricName": "RequestCount",
          "Dimensions": [
            {"Name": "LoadBalancer", "Value": "app/my-alb/1234567890"}
          ]
        },
        "Period": 300,
        "Stat": "Sum"
      },
      "ReturnData": false
    },
    {
      "Id": "error_rate",
      "Expression": "IF(requests > 0, 100 * FILL(errors, 0) / requests, 0)",
      "ReturnData": true
    }
  ]' \
  --threshold 5 \
  --comparison-operator GreaterThanThreshold \
  --evaluation-periods 2 \
  --alarm-actions arn:aws:sns:ap-northeast-2:123456789012:alerts
该表达式衡量的是 ALB 转发到目标的请求中出现的目标端 5xx 响应。它并不涵盖所有用户可见的失败,例如 ALB 自身生成的错误或在选择目标之前发生的失败。当存在请求时,缺失的 5xx 数据点会被填充为零;此处将零请求定义为 0%。请单独监控请求缺失或采集缺失的情况。经典指标数学告警必须返回一条最终时间序列。SEARCH 用于图表,不能作为告警表达式使用。由于评估范围会变化,RATE 在稀疏指标上的行为可能不同。
指标数学函数
# Commonly used functions
math-functions:
  # Arithmetic operations
  - "m1 + m2"           # Sum
  - "m1 - m2"           # Difference
  - "m1 * m2"           # Product
  - "m1 / m2"           # Division
  - "(m1 / m2) * 100"   # Percentage

  # Statistical functions
  - "AVG(METRICS())"    # Average
  - "SUM(METRICS())"    # Sum
  - "MIN(METRICS())"    # Minimum
  - "MAX(METRICS())"    # Maximum

  # Conditional functions
  - "IF(m1 > 100, m1, 0)"  # Conditional

  # Time-related
  - "RATE(m1)"          # Rate of change
  - "DIFF(m1)"          # Difference
  - "PERIOD(m1)"        # Period

  # Search
  - "SEARCH('{AWS/EC2,InstanceId} MetricName=\"CPUUtilization\"', 'Average', 300)"
Composite Alarms
复合告警概念
Composite Alarms 可以组合多个 Metric Alarms 来定义复杂条件。
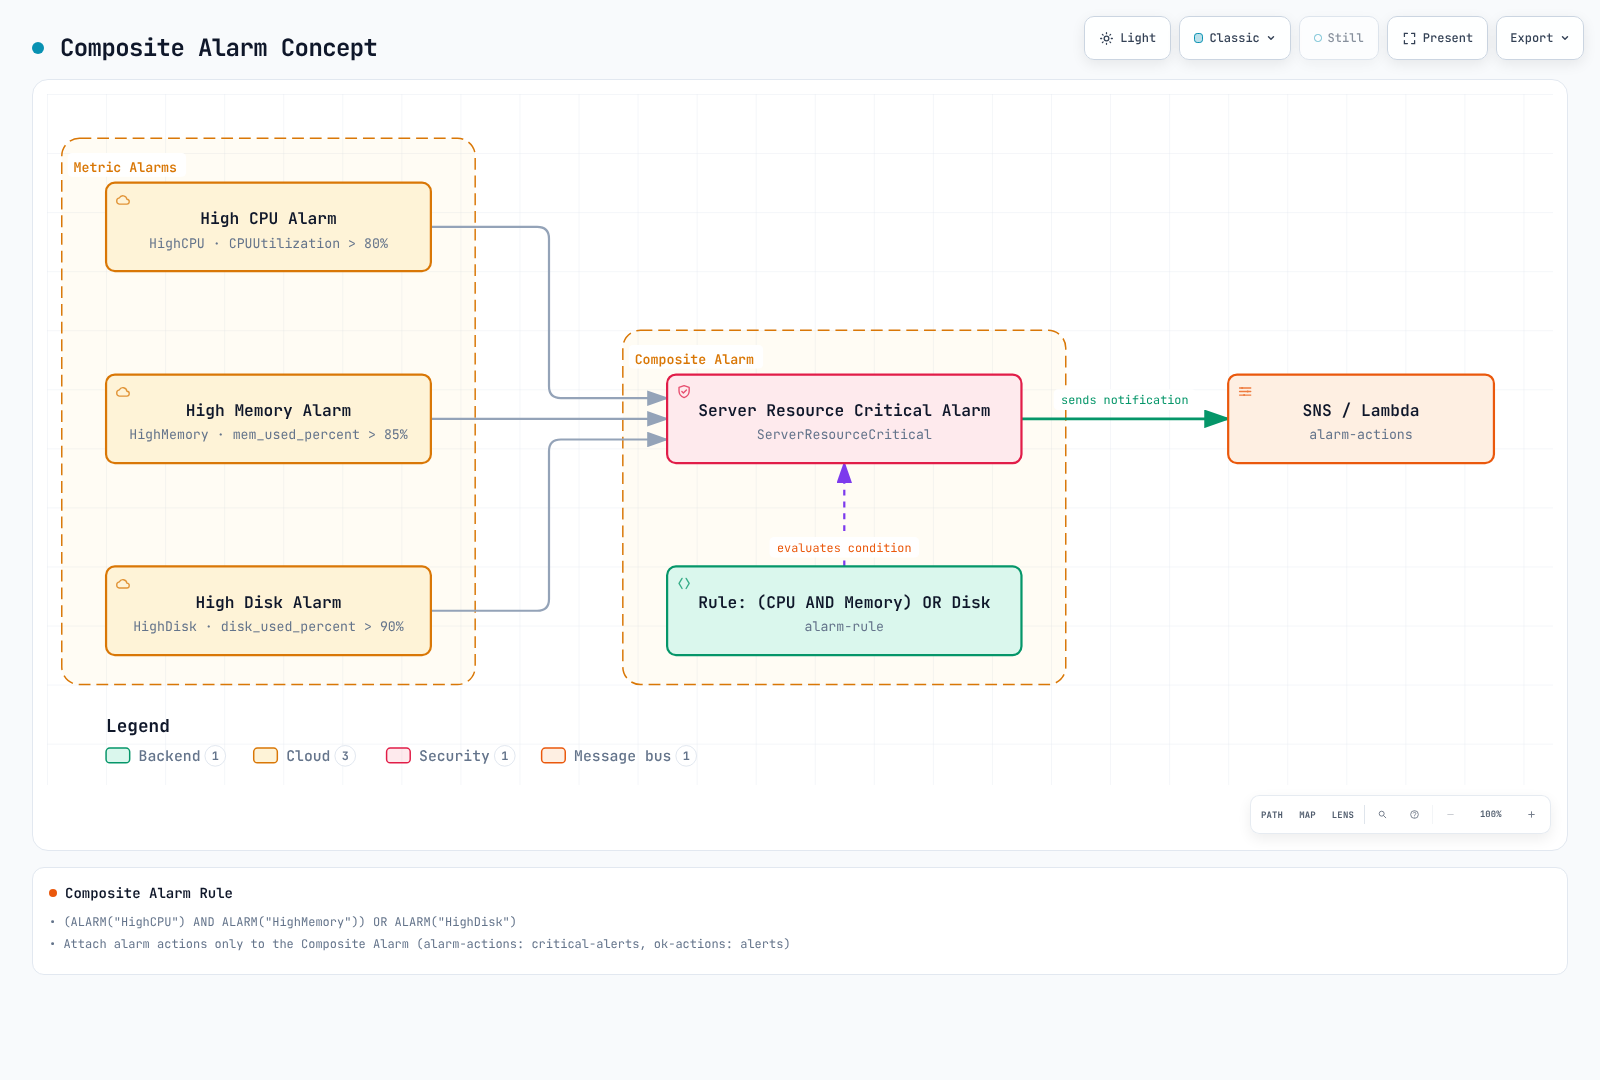
CWAgent 的内存和磁盘指标需要已安装 agent,并发布匹配的维度组合。仅使用 InstanceId 的示例只有在 agent 确实发布了该聚合时才有效。disk_used_percent 通常还带有 path、device 和 fstype;请使用 list-metrics 返回的完整维度组合。示例中的子告警没有配置动作;只有复合告警发送通知。
创建复合告警
# Create individual alarms
aws cloudwatch put-metric-alarm \
  --alarm-name "HighCPU" \
  --metric-name CPUUtilization \
  --namespace AWS/EC2 \
  --statistic Average \
  --period 300 \
  --threshold 80 \
  --comparison-operator GreaterThanThreshold \
  --evaluation-periods 2 \
  --dimensions Name=InstanceId,Value=i-1234567890abcdef0

aws cloudwatch put-metric-alarm \
  --alarm-name "HighMemory" \
  --metric-name mem_used_percent \
  --namespace CWAgent \
  --statistic Average \
  --period 300 \
  --threshold 85 \
  --comparison-operator GreaterThanThreshold \
  --evaluation-periods 2 \
  --dimensions Name=InstanceId,Value=i-1234567890abcdef0

aws cloudwatch put-metric-alarm \
  --alarm-name "HighDisk" \
  --metric-name disk_used_percent \
  --namespace CWAgent \
  --statistic Average \
  --period 300 \
  --threshold 90 \
  --comparison-operator GreaterThanThreshold \
  --evaluation-periods 2 \
  --dimensions Name=InstanceId,Value=i-1234567890abcdef0

# Create Composite Alarm
aws cloudwatch put-composite-alarm \
  --alarm-name "ServerResourceCritical" \
  --alarm-description "Server resources are critical" \
  --alarm-rule '(ALARM("HighCPU") AND ALARM("HighMemory")) OR ALARM("HighDisk")' \
  --alarm-actions arn:aws:sns:ap-northeast-2:123456789012:critical-alerts \
  --ok-actions arn:aws:sns:ap-northeast-2:123456789012:alerts
告警规则语法
# Composite Alarm rule syntax
rule-syntax:
  # Basic operators
  - "ALARM(alarm-name)"      # Check ALARM state
  - "OK(alarm-name)"         # Check OK state
  - "INSUFFICIENT_DATA(alarm-name)"  # Check INSUFFICIENT_DATA state

  # Logical operators
  - "AND"                    # All conditions met
  - "OR"                     # One or more conditions met
  - "NOT"                    # Negation
  - "()"                     # Grouping

examples:
  # All conditions met
  - "ALARM(A1) AND ALARM(A2) AND ALARM(A3)"

  # One or more met
  - "ALARM(A1) OR ALARM(A2)"

  # Complex condition
  - "(ALARM(A1) AND ALARM(A2)) OR ALARM(A3)"

  # Negation
  - "ALARM(A1) AND NOT ALARM(A2)"

  # M of N pattern (2 or more of 3)
  - "(ALARM(A1) AND ALARM(A2)) OR (ALARM(A1) AND ALARM(A3)) OR (ALARM(A2) AND ALARM(A3))"
告警抑制模式
set-alarm-state 只是用于测试的临时覆盖;指标告警会很快回到其评估状态,并不能建立维护窗口。下面的示例假设有一个外部控制器持续发布 MaintenanceMode 告警的状态。ActionsSuppressor 在不改变自身评估状态的前提下抑制复合告警的动作。测试维护窗口时请把等待期/延长期一并考虑在内。
aws cloudwatch put-composite-alarm  \
  --alarm-name ProductionAlerts  \
  --alarm-rule 'ALARM("HighCPU")'  \
  --actions-suppressor MaintenanceMode  \
  --actions-suppressor-wait-period 60  \
  --actions-suppressor-extension-period 60  \
  --alarm-actions arn:aws:sns:ap-northeast-2:123456789012:alerts
Anomaly Detection
异常检测概述
CloudWatch Anomaly Detection 使用机器学习学习指标的正常模式,并检测离群值。
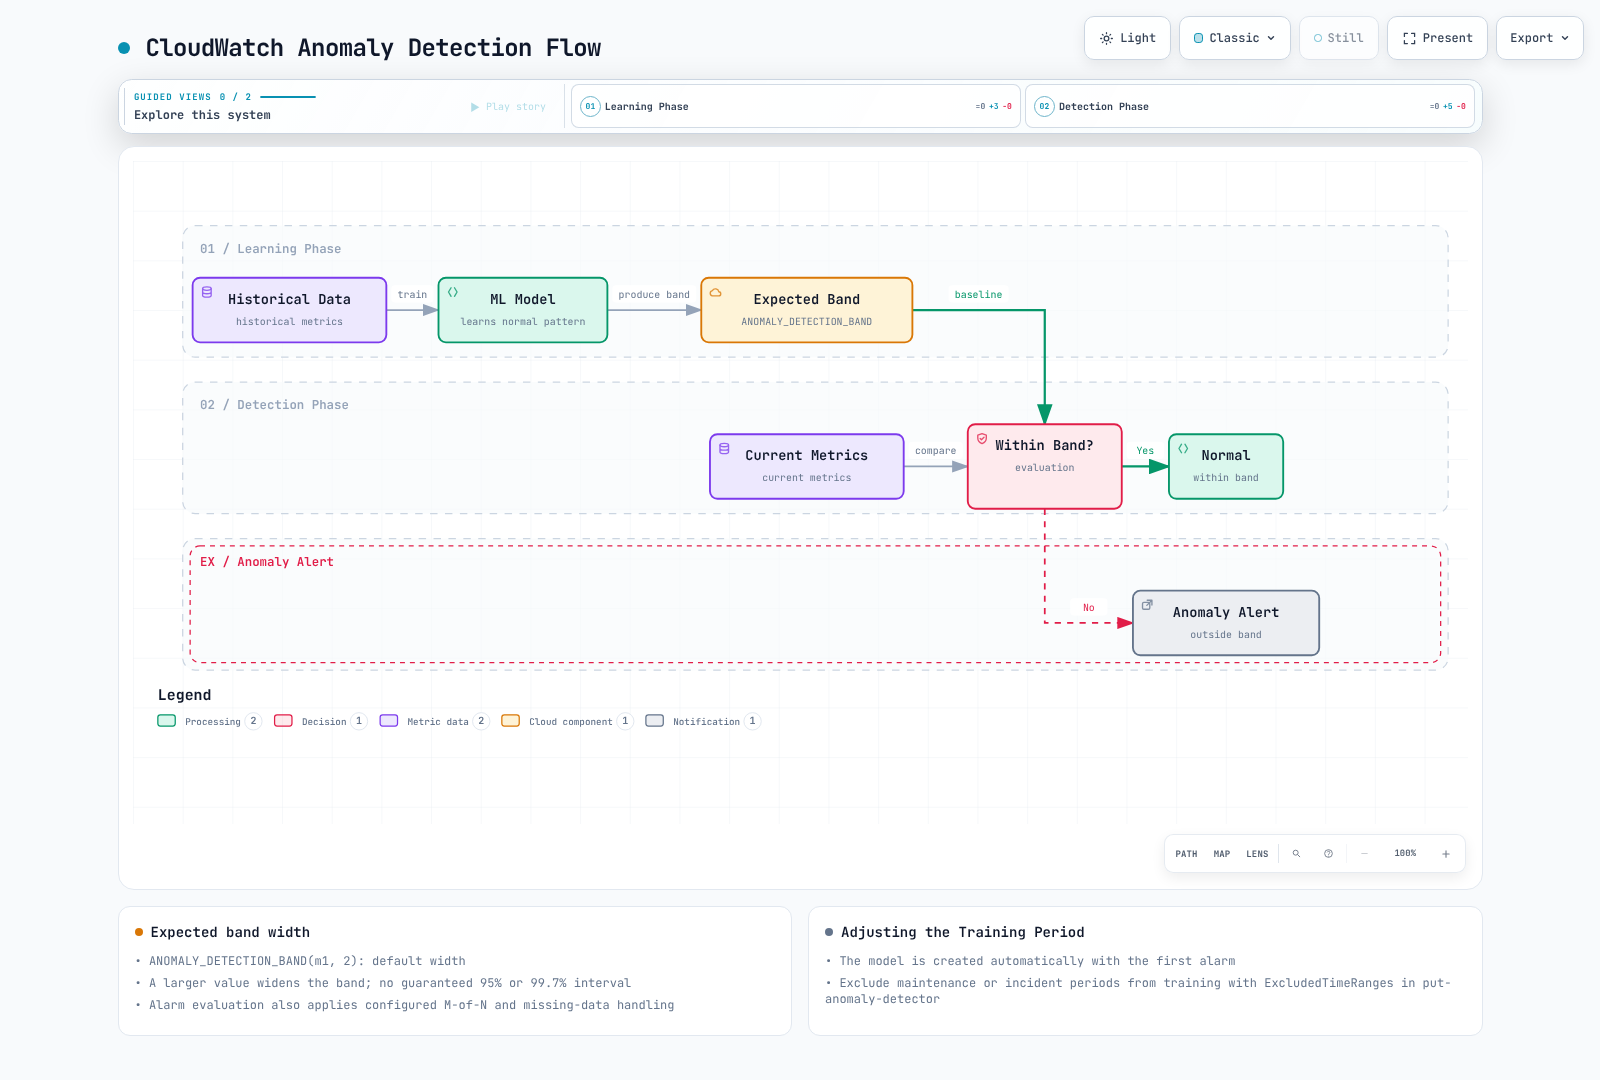
创建异常检测告警
# Anomaly Detection model creation (automatic)
# Model is automatically created when first alarm is created

aws cloudwatch put-metric-alarm \
  --alarm-name "CPUAnomalyDetection" \
  --alarm-description "CPU usage is anomalous" \
  --metrics '[
    {
      "Id": "m1",
      "MetricStat": {
        "Metric": {
          "Namespace": "AWS/EC2",
          "MetricName": "CPUUtilization",
          "Dimensions": [
            {"Name": "InstanceId", "Value": "i-1234567890abcdef0"}
          ]
        },
        "Period": 300,
        "Stat": "Average"
      },
      "ReturnData": true
    },
    {
      "Id": "ad1",
      "Expression": "ANOMALY_DETECTION_BAND(m1, 2)",
      "ReturnData": true
    }
  ]' \
  --threshold-metric-id ad1 \
  --comparison-operator LessThanLowerOrGreaterThanUpperThreshold \
  --evaluation-periods 2 \
  --alarm-actions arn:aws:sns:ap-northeast-2:123456789012:alerts
异常检测配置
# ANOMALY_DETECTION_BAND function
# ANOMALY_DETECTION_BAND(metric, stddev)
# - metric: Metric to analyze
# - stddev: Standard deviation multiplier (default 2)

examples:
  # Width parameter 2: not a guaranteed 95% confidence interval
  - "ANOMALY_DETECTION_BAND(m1, 2)"

  # Width parameter 3: a wider expected band
  - "ANOMALY_DETECTION_BAND(m1, 3)"

  # More sensitive detection (1 standard deviation)
  - "ANOMALY_DETECTION_BAND(m1, 1)"
该参数控制模型预期带的宽度,并不保证是高斯分布下的 95% 或 99.7% 区间。模型最多使用两周的历史数据,也可以在数据更少时开始工作。下面的排除日期仅用于说明格式;请替换为模型训练历史范围内的相关时间区间。
调整模型训练周期
# Add exclusion periods to existing model (maintenance, incident periods, etc.)
aws cloudwatch put-anomaly-detector \
  --namespace AWS/EC2 \
  --metric-name CPUUtilization \
  --stat Average \
  --dimensions Name=InstanceId,Value=i-1234567890abcdef0 \
  --configuration '{
    "ExcludedTimeRanges": [
      {
        "StartTime": "2025-02-15T00:00:00Z",
        "EndTime": "2025-02-15T06:00:00Z"
      }
    ]
  }'
SNS Integration
创建 SNS Topic
# Create SNS Topic
aws sns create-topic --name eks-alerts

# Add Email subscription
aws sns subscribe \
  --topic-arn arn:aws:sns:ap-northeast-2:123456789012:eks-alerts \
  --protocol email \
  --notification-endpoint team@example.com

# Add SMS subscription
aws sns subscribe \
  --topic-arn arn:aws:sns:ap-northeast-2:123456789012:eks-alerts \
  --protocol sms \
  --notification-endpoint "$VERIFIED_SMS_NUMBER"

# Add Lambda subscription
aws sns subscribe \
  --topic-arn arn:aws:sns:ap-northeast-2:123456789012:eks-alerts \
  --protocol lambda \
  --notification-endpoint arn:aws:lambda:ap-northeast-2:123456789012:function:alert-handler
SNS 消息过滤
CloudWatch 默认的 SNS 通知不会自动包含示例中的 severity 或 environment 消息属性。要过滤消息正文中的 NewStateValue,需要设置 FilterPolicyScope=MessageBody。该过滤器会排除 OK 恢复消息。Email 需要确认订阅;SMS 需要检查已验证号码、沙箱/Region 要求以及成本。Lambda 订阅还需要 Lambda 资源策略,允许来自特定 topic ARN 的 sns.amazonaws.com 调用。
aws sns set-subscription-attributes  \
  --subscription-arn "$SUBSCRIPTION_ARN"  \
  --attribute-name FilterPolicyScope  \
  --attribute-value MessageBody
aws sns set-subscription-attributes  \
  --subscription-arn "$SUBSCRIPTION_ARN"  \
  --attribute-name FilterPolicy  \
  --attribute-value '{"NewStateValue": ["ALARM"]}'
SNS 到 Slack 集成(Lambda)
对于标准 CloudWatch 通知,可通过 Amazon Q Developer in chat applications(原 AWS Chatbot)将 SNS topic 与已批准的 Slack 频道连接起来。请把该频道的 IAM 角色和护栏策略限制在通知用途范围内。
如果确实需要自定义 Lambda,请从密钥存储中获取 webhook、校验其目标地址、设置连接/读取超时并检查响应状态。不要把 HTTP 429/5xx 当作成功;请配置重试、死信路径和重复处理。SNS 使用 Records[].Sns.Message,而不是下文中的 EventBridge 信封结构。本章的验证不会发送真实的 Slack 消息。
EventBridge Integration
创建 EventBridge 规则
# Route CloudWatch Alarm state changes to EventBridge
aws events put-rule \
  --name "CloudWatchAlarmStateChange" \
  --event-pattern '{
    "source": ["aws.cloudwatch"],
    "detail-type": ["CloudWatch Alarm State Change"],
    "detail": {
      "state": {
        "value": ["ALARM"]
      }
    }
  }'

# Add Lambda target
aws events put-targets \
  --rule "CloudWatchAlarmStateChange" \
  --targets '[
    {
      "Id": "AlertHandler",
      "Arn": "arn:aws:lambda:ap-northeast-2:123456789012:function:alert-handler"
    }
  ]'
自动响应配置
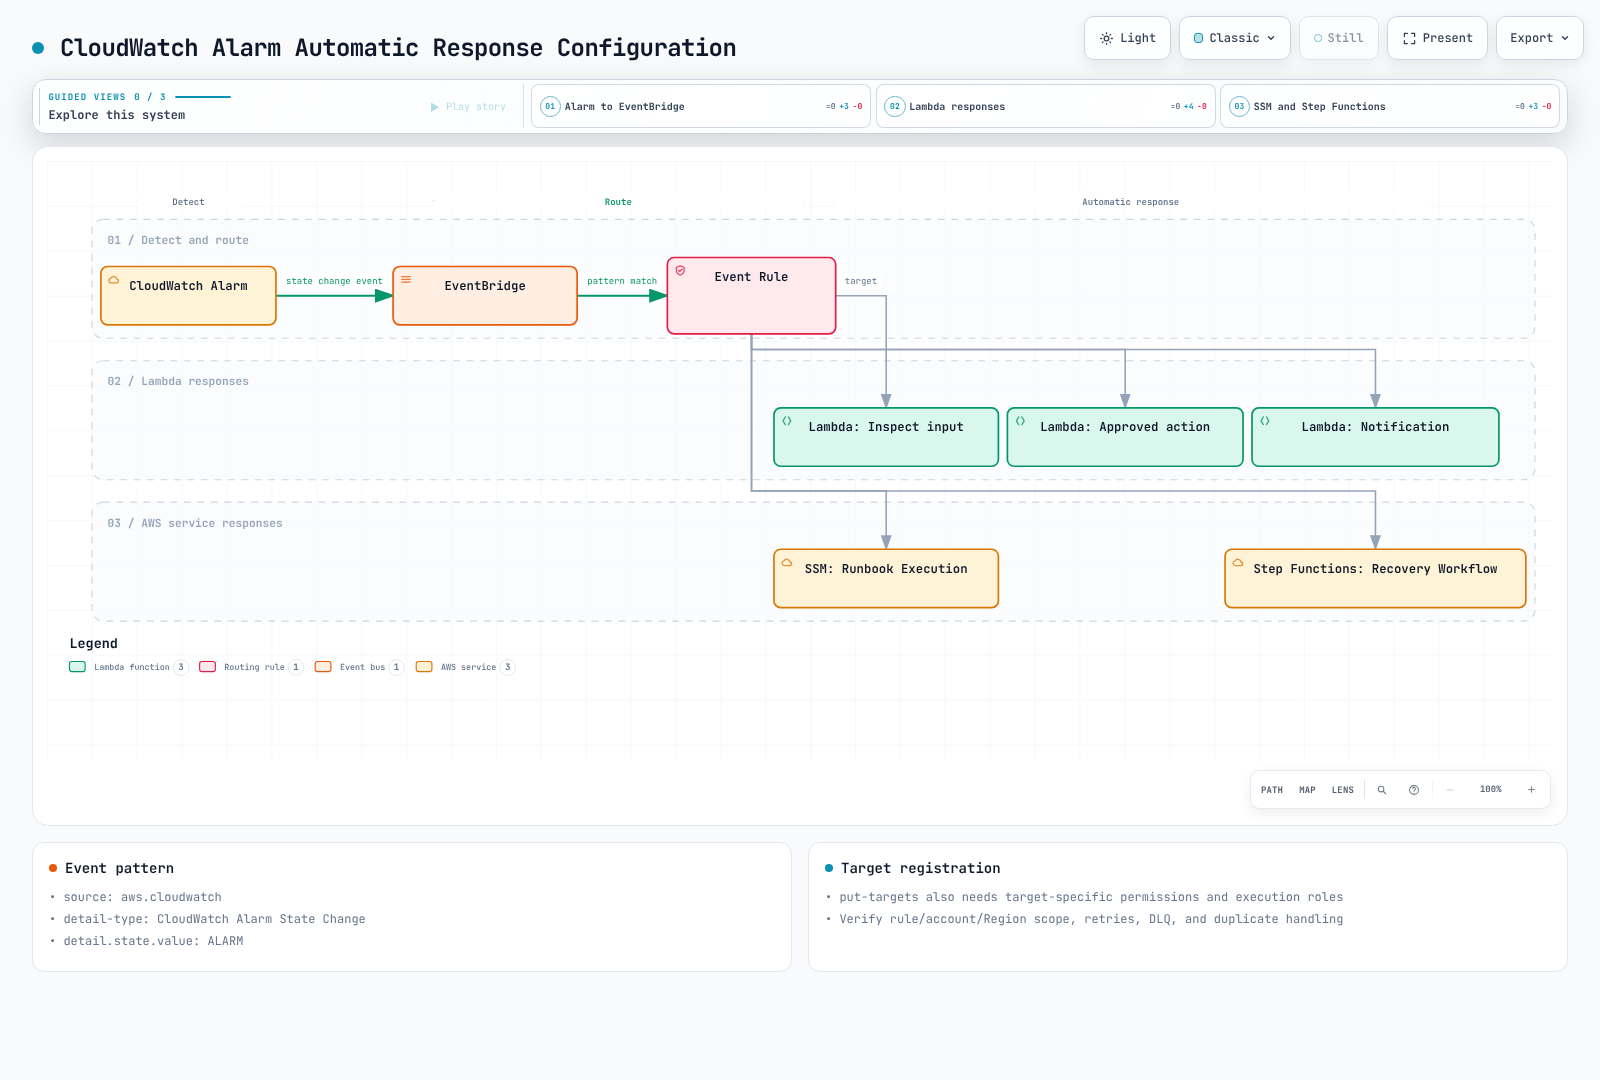
EventBridge 事件模式
{
  "source": ["aws.cloudwatch"],
  "detail-type": ["CloudWatch Alarm State Change"],
  "account": ["123456789012"],
  "region": ["ap-northeast-2"],
  "resources": ["arn:aws:cloudwatch:ap-northeast-2:123456789012:alarm:EKS-Node-HighCPU"],
  "detail": {
    "alarmName": ["EKS-Node-HighCPU"],
    "state": {"value": ["ALARM"]}
  }
}
把 previousState 限制为 OK 会漏掉 INSUFFICIENT_DATA → ALARM 的转换。匹配精确的告警 ARN 可以避免对指标数学或复合告警的配置形态做假设。put-targets 不会授予 Lambda 调用权限:需要为 events.amazonaws.com 添加 Lambda 资源策略,并将其限定到该规则的 SourceArn,同时配置重试/死信行为。
自动恢复 Lambda 示例
仅凭 CPU 偏高并不能证明重启是合适的处置方式。本示例实现的是恢复流程中的输入检查阶段:检查状态、账户、Region 和告警 ARN,然后返回指标信息。EventBridge 中的 dimensions 是一个对象,与 SNS 告警消息中的维度列表不同。它也能处理以表达式为先的查询以及不含指标的复合告警。
请将已测试的事件规范化器及其测试与 Lambda 处理程序一起打包:
from event_normalizer import normalize_alarm_event

def lambda_handler(event, context):
    return normalize_alarm_event(
        event,
        expected_account="123456789012",
        expected_region="ap-northeast-2",
    )
该函数不会对 AWS 执行任何变更操作。对负载的检查并不能认证发送方身份。任何新增的修复动作都需要显式的目标允许列表、当前告警/资源状态检查、幂等性、冷却时间、最小权限和回滚机制。
Container Insights Alerts
EKS Container Insights 指标
这些示例使用经典的 ContainerInsights CloudWatch 指标路径。不要把它的名称、维度和计费方式与增强型可观测性或 OTel 指标路径混用。请遵循当前的 EKS add-on 指南,该 add-on 会安装 CloudWatch Agent 和 Fluent Bit;并选择与集群 Kubernetes 版本和 Region 兼容的 add-on 版本。使用 EKS Pod Identity 时,请先配置 IAM 和 agent 关联。
update-addon 用于更新已有安装;首次安装应使用 create-addon。请保留现有配置和 Pod Identity 关联。请查询可用版本并在部署计划中选定其中一个,而不要固定使用旧的 v1.2.0 或应用未经审阅的 latest Fluentd manifest。
aws eks describe-addon-versions  \
  --addon-name amazon-cloudwatch-observability  \
  --kubernetes-version "$KUBERNETES_VERSION"  \
  --region "$AWS_REGION"
aws cloudwatch list-metrics  \
  --namespace ContainerInsights  \
  --metric-name pod_number_of_container_restarts  \
  --dimensions Name=ClusterName,Value=my-cluster  \
  --region "$AWS_REGION"
Container Insights 告警示例
# Cluster aggregate CPU utilization alarm
aws cloudwatch put-metric-alarm \
  --alarm-name "EKS-Node-HighCPU" \
  --metric-name node_cpu_utilization \
  --namespace ContainerInsights \
  --dimensions Name=ClusterName,Value=my-cluster \
  --statistic Average \
  --period 300 \
  --threshold 80 \
  --comparison-operator GreaterThanThreshold \
  --evaluation-periods 2 \
  --alarm-actions arn:aws:sns:ap-northeast-2:123456789012:eks-alerts

# Pod memory utilization alarm
aws cloudwatch put-metric-alarm \
  --alarm-name "EKS-Pod-HighMemory" \
  --metric-name pod_memory_utilization_over_pod_limit \
  --namespace ContainerInsights \
  --dimensions Name=ClusterName,Value=my-cluster Name=Namespace,Value=production \
  --statistic Average \
  --period 300 \
  --threshold 85 \
  --comparison-operator GreaterThanThreshold \
  --evaluation-periods 2 \
  --alarm-actions arn:aws:sns:ap-northeast-2:123456789012:eks-alerts

# One Pod's cumulative restart count (not a five-minute increase)
aws cloudwatch put-metric-alarm \
  --alarm-name "EKS-Pod-Restarts" \
  --metric-name pod_number_of_container_restarts \
  --namespace ContainerInsights \
  --dimensions Name=ClusterName,Value=my-cluster Name=Namespace,Value=production Name=PodName,Value=my-pod \
  --statistic Maximum \
  --period 300 \
  --threshold 3 \
  --comparison-operator GreaterThanThreshold \
  --evaluation-periods 1 \
  --alarm-actions arn:aws:sns:ap-northeast-2:123456789012:eks-alerts
CPU 示例是集群级聚合。针对单个节点需要使用 ClusterName、NodeName 和 InstanceId 的完整组合。pod_memory_utilization 除以的是节点内存,而 pod_memory_utilization_over_pod_limit 除以的是 Pod 限制。如果任一容器没有设置内存限制,后者可能不存在。pod_number_of_container_restarts 是累计值,使用 ClusterName、Namespace 和 PodName 维度。Maximum > 3 表示观测到的生命周期累计次数超过 3;对样本求和并不能统计近期的重启次数。还需考虑 Pod 被替换、计数重置和名称复用的情况。若要统计近期增量,请使用可感知重置的 PromQL increase(),或单独定义的增量指标。
主要 Container Insights 指标
| 指标 | 说明 | 维度 |
|---|---|---|
cluster_node_count | 集群节点数 | ClusterName |
cluster_failed_node_count | 故障节点数 | ClusterName |
node_cpu_utilization | 节点 CPU 使用率 | ClusterName, NodeName, InstanceId;或 ClusterName |
node_memory_utilization | 节点内存使用率 | ClusterName, NodeName, InstanceId;或 ClusterName |
node_filesystem_utilization | 节点磁盘使用率 | ClusterName, NodeName, InstanceId;或 ClusterName |
pod_cpu_utilization | Pod CPU 使用率 | ClusterName, Namespace, PodName |
pod_memory_utilization | Pod 内存使用率 | ClusterName, Namespace, PodName |
pod_number_of_container_restarts | 容器重启次数 | ClusterName, Namespace, PodName |
service_number_of_running_pods | 每个 Service 运行中的 Pod 数 | ClusterName, Namespace, Service |
CloudWatch Alarm Actions
EC2 动作
EC2 直接动作包括 stop、terminate、reboot 和 recover;不支持 start。这些示例会变更实例状态:请在确认受支持的实例、权限以及停止/恢复带来的影响后,仅对明确批准的目标使用。缺失数据请使用 missing,并且只把变更类动作绑定到 ALARM 状态。指标数学告警和复合告警无法直接执行 EC2 动作。
# EC2 instance recovery (on system status check failure)
aws cloudwatch put-metric-alarm \
  --alarm-name "EC2-SystemCheckFailed" \
  --metric-name StatusCheckFailed_System \
  --namespace AWS/EC2 \
  --dimensions Name=InstanceId,Value=i-1234567890abcdef0 \
  --statistic Maximum \
  --period 60 \
  --threshold 1 \
  --comparison-operator GreaterThanOrEqualToThreshold \
  --evaluation-periods 2 \
  --treat-missing-data missing \
  --alarm-actions arn:aws:automate:ap-northeast-2:ec2:recover

# EC2 instance stop
aws cloudwatch put-metric-alarm \
  --alarm-name "EC2-LowUtilization-Stop" \
  --metric-name CPUUtilization \
  --namespace AWS/EC2 \
  --dimensions Name=InstanceId,Value=i-1234567890abcdef0 \
  --statistic Average \
  --period 3600 \
  --threshold 5 \
  --comparison-operator LessThanThreshold \
  --evaluation-periods 24 \
  --treat-missing-data missing \
  --alarm-actions arn:aws:automate:ap-northeast-2:ec2:stop
Auto Scaling 动作
# Link Auto Scaling policy
aws cloudwatch put-metric-alarm \
  --alarm-name "ASG-ScaleOut" \
  --metric-name CPUUtilization \
  --namespace AWS/EC2 \
  --dimensions Name=AutoScalingGroupName,Value=my-asg \
  --statistic Average \
  --period 300 \
  --threshold 70 \
  --comparison-operator GreaterThanThreshold \
  --evaluation-periods 2 \
  --alarm-actions arn:aws:autoscaling:ap-northeast-2:123456789012:scalingPolicy:xxx:autoScalingGroupName/my-asg:policyName/scale-out

aws cloudwatch put-metric-alarm \
  --alarm-name "ASG-ScaleIn" \
  --metric-name CPUUtilization \
  --namespace AWS/EC2 \
  --dimensions Name=AutoScalingGroupName,Value=my-asg \
  --statistic Average \
  --period 300 \
  --threshold 30 \
  --comparison-operator LessThanThreshold \
  --evaluation-periods 3 \
  --alarm-actions arn:aws:autoscaling:ap-northeast-2:123456789012:scalingPolicy:xxx:autoScalingGroupName/my-asg:policyName/scale-in
Systems Manager 动作
automation-definition/... 形式的 ARN 并不是受支持的 AlarmActions 直接目标,无法用于运行任意 SSM Automation runbook。SSM 的直接集成仅支持 API 中列出的动作,例如 OpsItems。请通过 EventBridge 的 SSM Automation 目标,或显式的 Lambda/Step Functions 工作流来触发 Automation。目标执行角色、ssm:StartAutomationExecution、runbook 参数和 Automation 角色都应分别限定权限范围。仅凭磁盘阈值不得授权任意文件删除。
Cost Optimization
成本构成因素
下表数字是 2026-09-13 查阅官方定价页面时的 US East 示例,并非首尔 Region 的报价。请查询目标 Region 的当前价格。指标告警按被评估的指标计费,而复合告警按告警个数计费。异常检测包含实际指标以及预期区间的上界和下界两条指标。添加复合告警不会免除子告警的费用:它减少的是通知噪音,而不会自动降低成本。
| 项目 | 费用 |
|---|---|
| 标准分辨率告警(60s) | $0.10/告警/月 |
| 高分辨率告警(10s) | $0.30/告警/月 |
| 标准异常检测告警:一条实际指标加预期区间的上界和下界两条指标 | 示例 $0.30/告警/月 |
| 复合告警(Composite Alarm) | $0.50/告警/月 |
成本优化策略
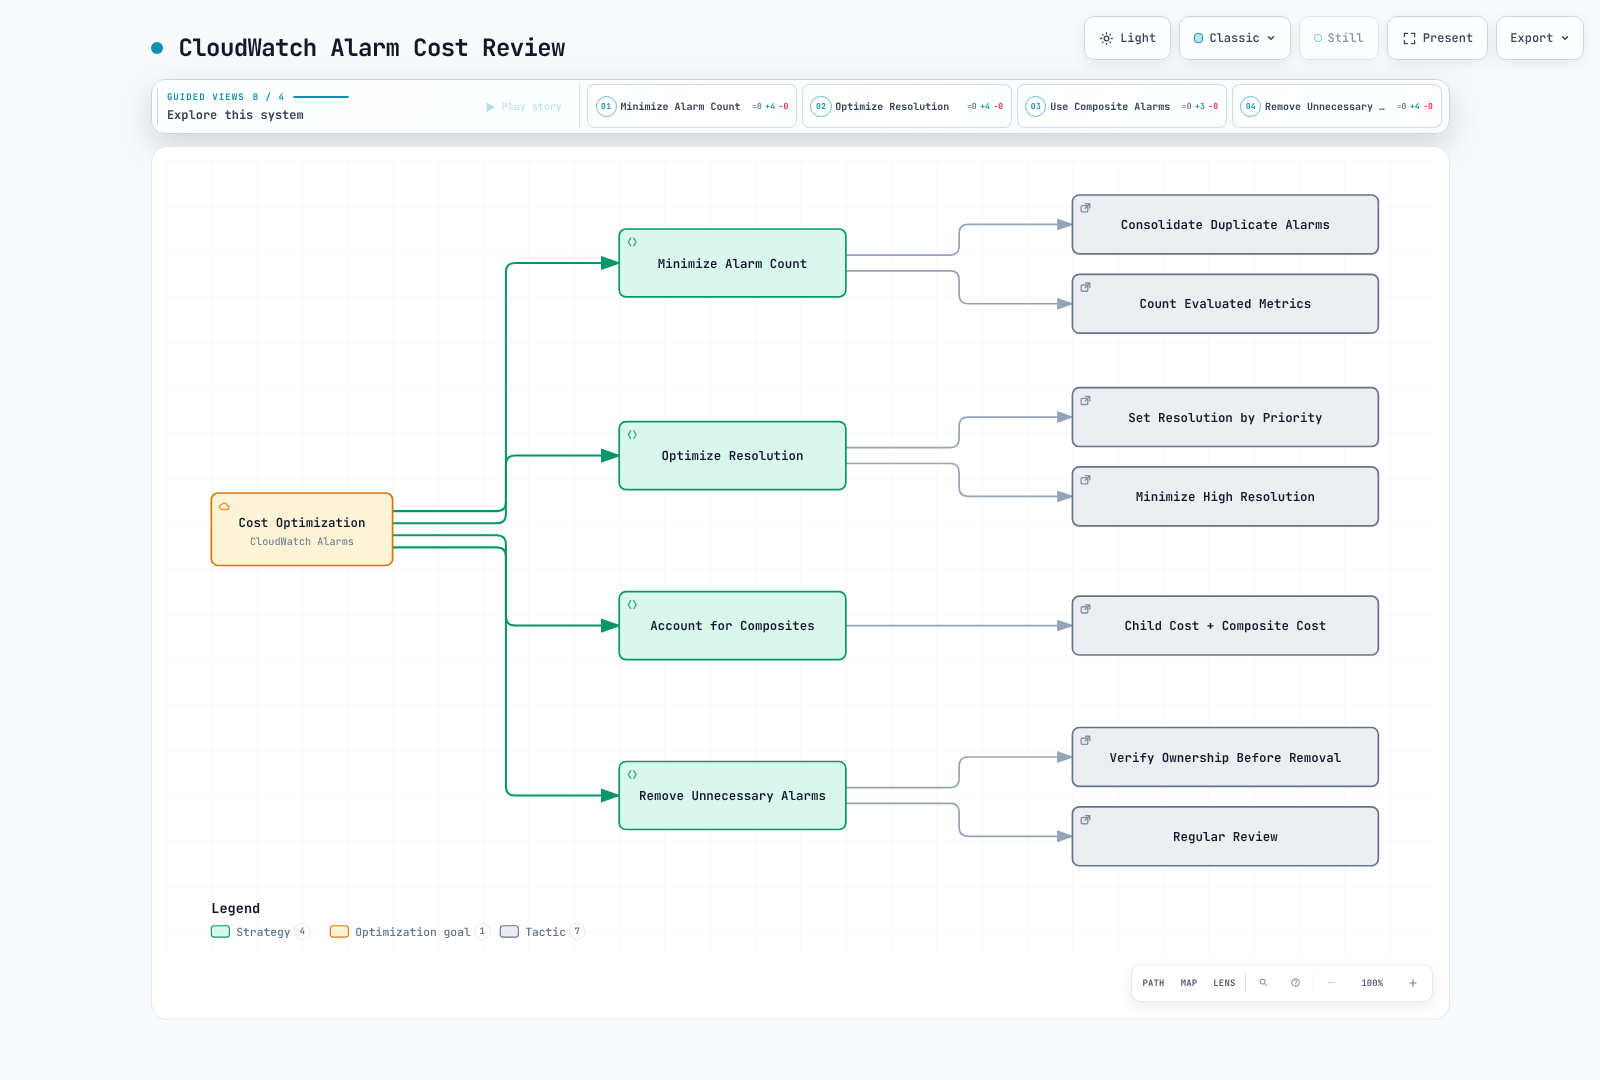
推荐设置
# Cost-effective alarm settings

# Critical: Standard Resolution (60s; only 10/20/30s is high resolution)
critical-alerts:
  period: 60  # 1 minute
  evaluation-periods: 2

# Warning: Standard Resolution
warning-alerts:
  period: 300  # 5 minutes
  evaluation-periods: 2

# Info: Standard Resolution (relaxed detection)
info-alerts:
  period: 900  # 15 minutes
  evaluation-periods: 3
告警清理脚本
下面的命令只列出待检查的候选项。INSUFFICIENT_DATA 并不能证明某个告警未被使用,固定的历史日期也不等于“90 天前”。在获得单独授权执行删除之前,请先审查距 StateTransitionedTimestamp 的时间、实际采集情况、归属方以及复合告警依赖关系。StateUpdatedTimestamp 在状态原因变化时也会更新,它与处于当前状态的时长并不相同。
aws cloudwatch describe-alarms  \
  --alarm-types MetricAlarm  \
  --state-value INSUFFICIENT_DATA  \
  --query 'MetricAlarms[].{Name:AlarmName,StateSince:StateTransitionedTimestamp,Updated:StateUpdatedTimestamp}'  \
  --output json
Prometheus Metrics Integration
Amazon Managed Prometheus (AMP) 集成
存储在 AMP 中的指标不会自动复制到经典 CloudWatch 指标中。请根据需求选择合适的路径。
- 在 AMP 内部告警:配置工作区 Prometheus 告警规则 → 托管 Alertmanager → 受支持的接收器(SNS 或 PagerDuty)。
- CloudWatch PromQL 告警:评估通过 CloudWatch OTLP 端点摄取的指标。这并不是直接查询 AMP 工作区。
- 重新发布为经典 CloudWatch 指标:在独立的 exporter 中只定义必需的聚合值。使用一套一致且冻结的临时凭证进行签名,并校验超时、HTTP 状态、结果类型、数值有限性、时间戳和维度。不要把空结果、NaN 或失败转换成零或成功。这会带来查询费用、自定义指标费用、运行时成本和延迟。
以前使用的 CPU mode 平均值并不是总体 CPU 使用率;对彼此无关或未设限制的 Pod 求内存平均值之比,也不等于每个 Pod 的限制使用率。请选择能保留所需标签和重置语义的 PromQL,然后测试规则并用实际采集的数据进行验证。
Terraform Examples
下面这些代码块构成一个示例模块。请配置真实的资源取值和 SNS topic 策略,并在部署前审查 terraform plan。示例验证只覆盖 provider schema/语法,不包括 AWS 实际部署或真实通知投递。
基础告警
# SNS Topic
resource "aws_sns_topic" "alerts" {
  name = "eks-alerts"
}

resource "aws_sns_topic_subscription" "email" {
  topic_arn = aws_sns_topic.alerts.arn
  protocol  = "email"
  endpoint  = "team@example.com"
}

# EC2 CPU alarm
resource "aws_cloudwatch_metric_alarm" "ec2_cpu" {
  alarm_name          = "ec2-high-cpu"
  comparison_operator = "GreaterThanThreshold"
  evaluation_periods  = 2
  metric_name         = "CPUUtilization"
  namespace           = "AWS/EC2"
  period              = 300
  statistic           = "Average"
  threshold           = 80
  alarm_description   = "EC2 CPU usage exceeds 80%"

  dimensions = {
    InstanceId = "i-1234567890abcdef0"
  }

  alarm_actions = [aws_sns_topic.alerts.arn]
  ok_actions    = [aws_sns_topic.alerts.arn]

  treat_missing_data = "missing"
}
指标数学告警
resource "aws_cloudwatch_metric_alarm" "alb_error_rate" {
  alarm_name          = "alb-high-error-rate"
  comparison_operator = "GreaterThanThreshold"
  evaluation_periods  = 2
  threshold           = 5
  alarm_description   = "ALB error rate exceeds 5%"

  metric_query {
    id          = "errors"
    return_data = false

    metric {
      metric_name = "HTTPCode_Target_5XX_Count"
      namespace   = "AWS/ApplicationELB"
      period      = 300
      stat        = "Sum"

      dimensions = {
        LoadBalancer = "app/my-alb/1234567890"
      }
    }
  }

  metric_query {
    id          = "requests"
    return_data = false

    metric {
      metric_name = "RequestCount"
      namespace   = "AWS/ApplicationELB"
      period      = 300
      stat        = "Sum"

      dimensions = {
        LoadBalancer = "app/my-alb/1234567890"
      }
    }
  }

  metric_query {
    id          = "error_rate"
    expression  = "IF(requests > 0, 100 * FILL(errors, 0) / requests, 0)"
    label       = "Error Rate"
    return_data = true
  }

  alarm_actions = [aws_sns_topic.alerts.arn]
}
复合告警
# Individual alarms
resource "aws_cloudwatch_metric_alarm" "cpu_alarm" {
  alarm_name          = "high-cpu"
  comparison_operator = "GreaterThanThreshold"
  evaluation_periods  = 2
  metric_name         = "CPUUtilization"
  namespace           = "AWS/EC2"
  period              = 300
  statistic           = "Average"
  threshold           = 80

  dimensions = {
    InstanceId = "i-1234567890abcdef0"
  }
}

resource "aws_cloudwatch_metric_alarm" "memory_alarm" {
  alarm_name          = "high-memory"
  comparison_operator = "GreaterThanThreshold"
  evaluation_periods  = 2
  metric_name         = "mem_used_percent"
  namespace           = "CWAgent"
  period              = 300
  statistic           = "Average"
  threshold           = 85

  dimensions = {
    InstanceId = "i-1234567890abcdef0"
  }
}

# Composite Alarm
resource "aws_cloudwatch_composite_alarm" "server_critical" {
  alarm_name        = "server-critical"
  alarm_description = "Server CPU and Memory are both high"

  alarm_rule = "ALARM(${aws_cloudwatch_metric_alarm.cpu_alarm.alarm_name}) AND ALARM(${aws_cloudwatch_metric_alarm.memory_alarm.alarm_name})"

  alarm_actions = [aws_sns_topic.alerts.arn]
  ok_actions    = [aws_sns_topic.alerts.arn]
}
EKS Container Insights 告警
resource "aws_cloudwatch_metric_alarm" "eks_node_cpu" {
  alarm_name          = "eks-node-high-cpu"
  comparison_operator = "GreaterThanThreshold"
  evaluation_periods  = 2
  metric_name         = "node_cpu_utilization"
  namespace           = "ContainerInsights"
  period              = 300
  statistic           = "Average"
  threshold           = 80
  alarm_description   = "EKS Node CPU usage exceeds 80%"

  dimensions = {
    ClusterName = "my-eks-cluster"
  }

  alarm_actions = [aws_sns_topic.alerts.arn]
}

resource "aws_cloudwatch_metric_alarm" "eks_pod_restarts" {
  alarm_name          = "eks-pod-restarts"
  comparison_operator = "GreaterThanThreshold"
  evaluation_periods  = 1
  metric_name         = "pod_number_of_container_restarts"
  namespace           = "ContainerInsights"
  period              = 300
  statistic           = "Maximum"
  threshold           = 3
  alarm_description   = "Observed cumulative restart count exceeds 3; not a 5-minute increase"

  dimensions = {
    ClusterName = "my-eks-cluster"
    Namespace   = "production"
    PodName     = "my-pod"
  }

  alarm_actions = [aws_sns_topic.alerts.arn]
}
异常检测告警
resource "aws_cloudwatch_metric_alarm" "cpu_anomaly" {
  alarm_name          = "cpu-anomaly-detection"
  comparison_operator = "LessThanLowerOrGreaterThanUpperThreshold"
  evaluation_periods  = 2
  threshold_metric_id = "ad1"
  alarm_description   = "CPU usage is anomalous"

  metric_query {
    id          = "m1"
    return_data = true

    metric {
      metric_name = "CPUUtilization"
      namespace   = "AWS/EC2"
      period      = 300
      stat        = "Average"

      dimensions = {
        InstanceId = "i-1234567890abcdef0"
      }
    }
  }

  metric_query {
    id          = "ad1"
    expression  = "ANOMALY_DETECTION_BAND(m1, 2)"
    label       = "CPUUtilization (Expected)"
    return_data = true
  }

  alarm_actions = [aws_sns_topic.alerts.arn]
}
参考资料
- CloudWatch alarm types
- PutMetricAlarm API
- Missing data evaluation
- Composite alarms and action suppression
- Metric math
- Anomaly detection
- SNS alarm message schemas
- SNS filter policy scope
- EventBridge alarm events
- EventBridge target permissions
- Container Insights metric dimensions
- CloudWatch Observability EKS add-on
- CloudWatch pricing
- PromQL alarms
- Log alarms
- AMP alert receivers
测验
请通过 CloudWatch Alarms 测验检验你的掌握程度。