告警概述
最后更新: September 13, 2026
审阅基线:Prometheus 3.14.0 与 Alertmanager 0.34.0。示例假定为单集群且时间序列已去重。请先确认实际的 job、标签、exporter 以及指标可用性,然后再调整阈值。仅执行了本地的规则/路由检查;未在任何集群或通知渠道上进行验证。
目录
告警的作用与重要性
告警在可观测性三大支柱中的位置
指标(metrics)、日志(logs)和追踪(traces)是常见的可观测性信号;此外还存在 profile 等其他信号。规则引擎并不一定直接评估这三者中的全部:
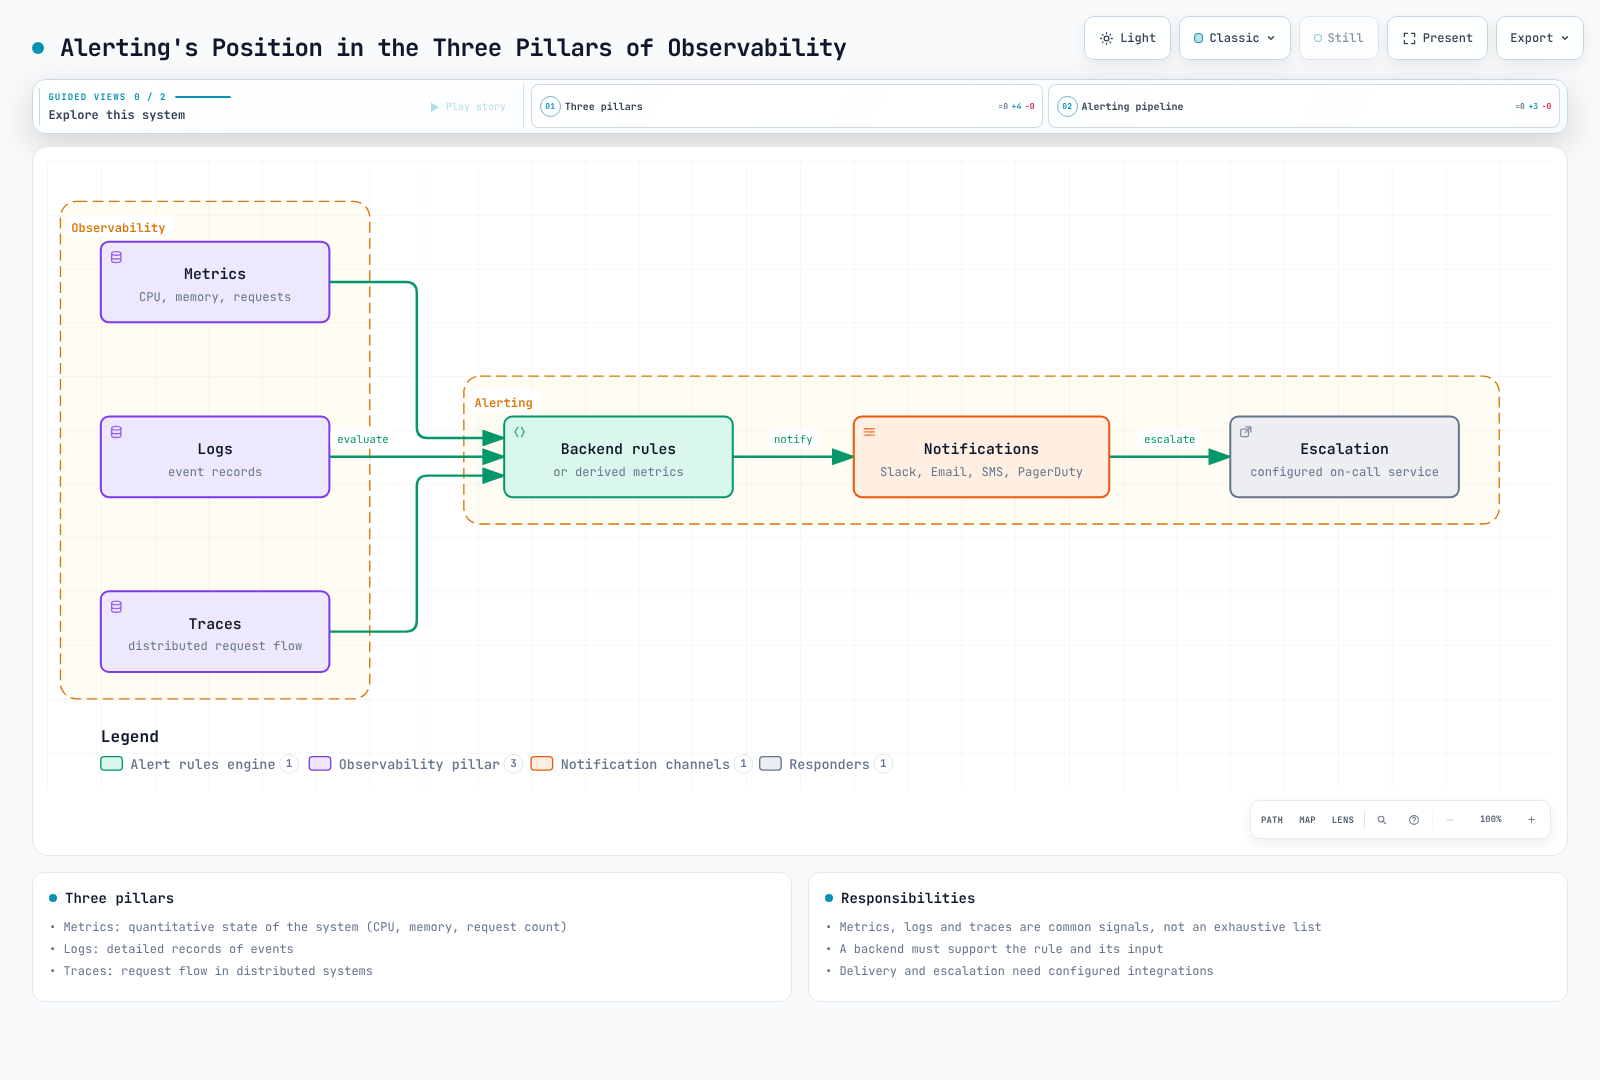
- 指标:系统的量化状态(CPU、内存、请求数等)
- 日志:事件的详细记录
- 追踪:分布式系统中的请求流转
Prometheus 规则评估指标。日志和追踪则通过各后端特定的规则或派生指标来触发告警。检测、通知与人工确认是彼此独立的阶段,投递是否成功需要单独监控。
为什么需要告警
- 主动响应问题:在用户感受到问题之前发现问题
- 最小化停机时间:通过快速检测与响应提升服务可用性
- 降低成本:通过自动化监控减少人力成本
- 满足 SLA/SLO:达成服务级别目标的必备组成部分
- 事故记录:追踪并分析问题发生的历史
好的告警 vs 差的告警
| 方面 | 好的告警 | 差的告警 |
|---|---|---|
| 可操作性 | 需要立即采取行动 | 仅供参考,无需行动 |
| 清晰度 | 问题是什么很明确 | 含糊不清 |
| 紧急程度 | 紧急程度与严重性匹配 | 一切都很紧急 |
| 频率 | 频率适当 | 过于频繁或过于稀少 |
| 重复性 | 相关告警已分组 | 同一个问题产生数十条告警 |
告警生命周期
下图将规则状态与事故响应结合在一起。Prometheus 使用 inactive/pending/firing;确认(acknowledgment)和处理中(work-in-progress)属于 on-call 工具。关闭事故并不会清除处于 firing 状态的规则。时间序列消失同样可以使规则变为非激活状态,绝不能将其视为已恢复的证据:
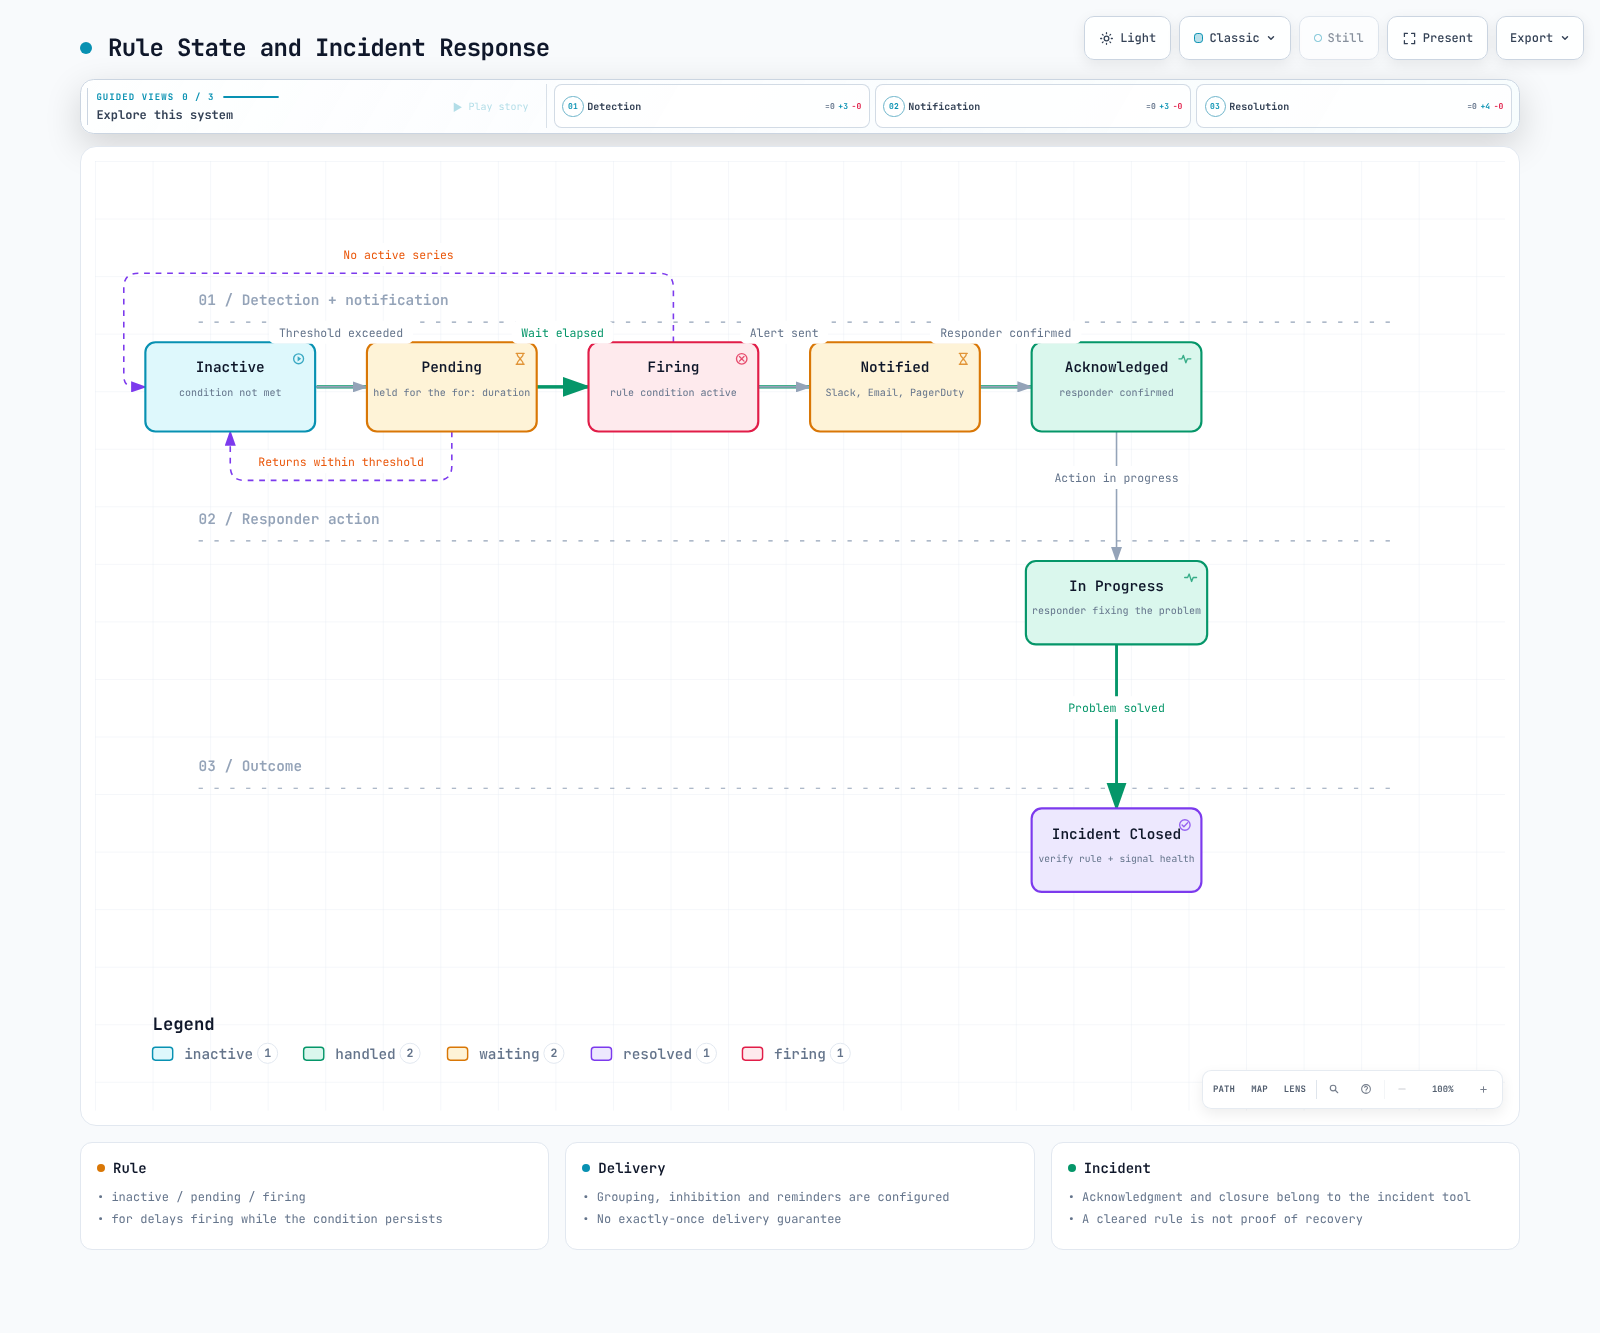
1. 检测
- 基于阈值:当某个特定值超过配置的阈值时
- 基于变化率:当变化率异常时
- 异常检测:基于机器学习的异常模式检测
- 日志模式:当出现特定日志模式时
groups:
  - name: node-alerts
    rules:
      - alert: HighCPUUsage
        expr: 100 * (1 - avg by (cluster, instance) (rate(node_cpu_seconds_total{mode="idle"}[5m]))) > 80
        for: 5m
        labels:
          severity: warning
          team: sre
        annotations:
          summary: "High CPU usage detected"
          description: "CPU usage is above 80% for 5 minutes on {{ $labels.instance }}"
2. 通知
- 渠道选择:Slack、Email、SMS、PagerDuty 等
- 路由:根据告警类型投递给合适的接收者
- 分组:将相关告警捆绑在一起
- 去重:减少重复通知;repeat_interval 提醒和重试仍可能发生,不提供恰好一次(exactly-once)的保证
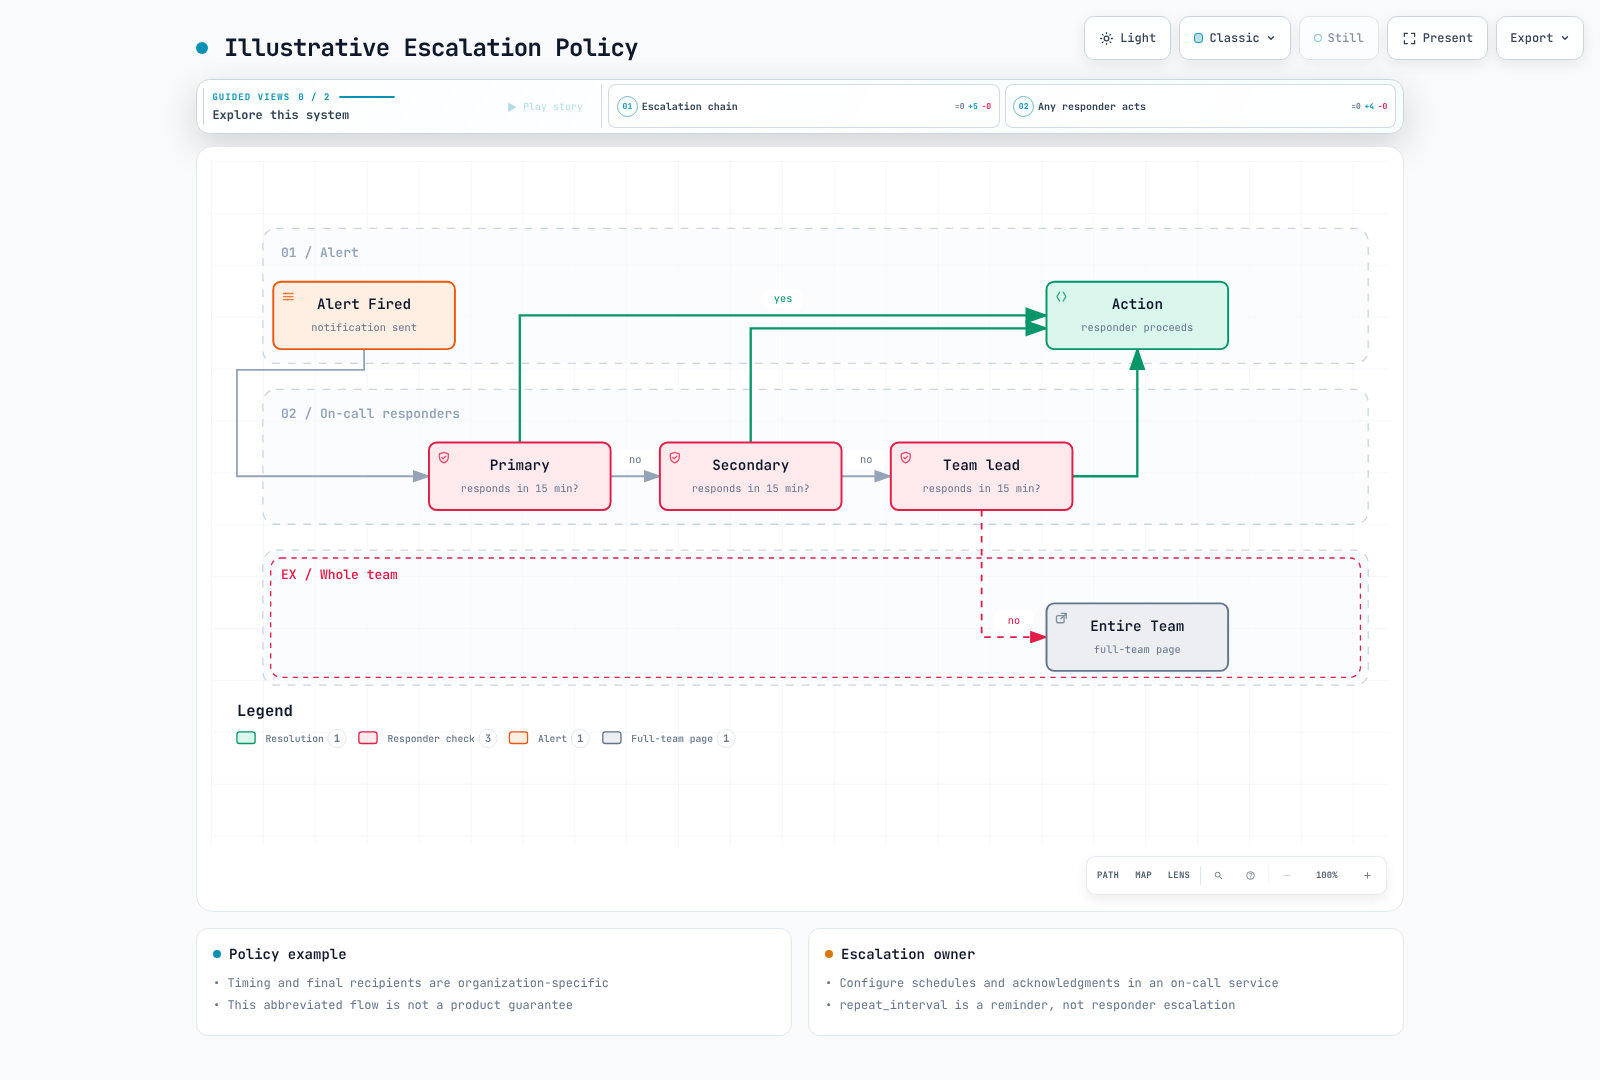
3. 升级
- 基于时间:若在指定时间内无响应,则升级到下一位响应者
- 基于严重性:根据严重性采用不同的升级路径
- 自动升级:在 on-call 服务中进行配置。Alertmanager 的 repeat_interval 既不检查确认状态,也不轮换响应者
4. 解决
- 手动解决:响应者在事故工具中关闭事故;规则状态需单独检查
- 自动解决:在检查规则与采集健康状况后,按照集成策略更新事故状态
- 解决通知:问题修复后发送解决通知
告警设计原则
1. 可操作的告警
打断他人的呼叫(page)需要有可立即执行的响应动作。信息性事件和较长期的工作可以改为进入工单或仪表板。
不好的示例:
Alert: Database connection count increased好的示例:
Alert: Database connection pool exhausted
Action Required: Confirm user impact; inspect pool saturation and connection leaks using the runbook
Runbook: https://example.com/runbooks/replace-db-runbook
2. 防止告警疲劳
告警过多可能导致重要告警被忽略。
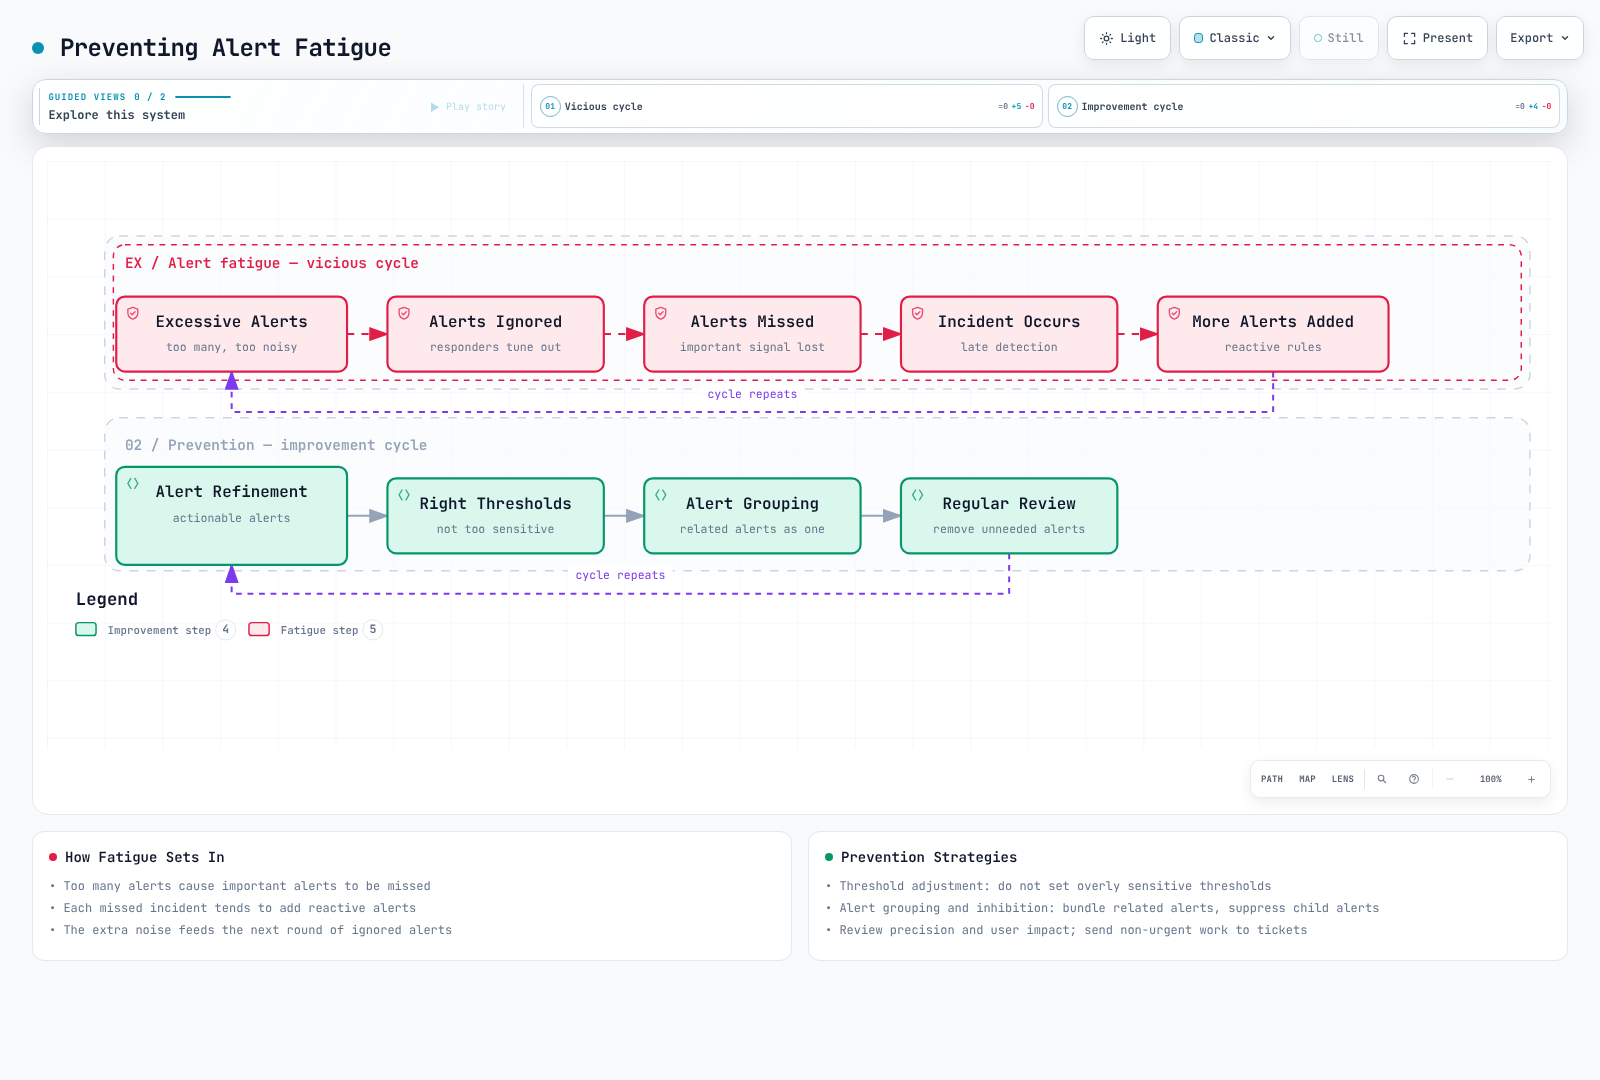
防止告警疲劳的策略:
- 调整阈值:不要设置过于敏感的阈值
- 告警分组:将相关告警合并为一条
- 抑制(Inhibition):当父告警触发时抑制子告警
- 定期审查:移除不必要的告警
- 逐步引入:新告警先以较低严重性上线
3. 严重性级别
以下响应时间为示例性的组织策略,并非产品 SLA 或通用建议:
| 严重性 | 说明 | 响应时间 | 示例 |
|---|---|---|---|
| Critical | 服务完全中断 | 立即(5 分钟内) | 服务整体宕机、存在数据丢失风险 |
| High | 主要功能故障 | 15 分钟内 | 支付系统错误、登录失败 |
| Warning | 潜在问题 | 1 小时内 | 磁盘使用率 80%、响应延迟上升 |
| Info | 信息性告警 | 工作时间内 | 部署完成、备份成功 |
groups:
  - name: disk-alerts
    rules:
      - alert: DiskSpaceCritical
        expr: |
          (100 * node_filesystem_avail_bytes{fstype!~"tmpfs|overlay|squashfs"}
            / node_filesystem_size_bytes{fstype!~"tmpfs|overlay|squashfs"} < 5)
          and node_filesystem_readonly == 0
          and node_filesystem_size_bytes > 0
        for: 5m
        labels:
          severity: critical
          team: sre
        annotations:
          summary: "Disk space critical"
      - alert: DiskSpaceWarning
        expr: |
          (100 * node_filesystem_avail_bytes{fstype!~"tmpfs|overlay|squashfs"}
            / node_filesystem_size_bytes{fstype!~"tmpfs|overlay|squashfs"} < 20)
          and node_filesystem_readonly == 0
          and node_filesystem_size_bytes > 0
        for: 10m
        labels:
          severity: warning
          team: sre
        annotations:
          summary: "Disk space low"
4. 告警文档
所有告警都应包含以下信息:
- 描述:该告警的含义
- 影响:该问题如何影响服务
- 处理步骤:解决问题的分步指南
- Runbook 链接:详细的响应流程文档
annotations:
  summary: "Investigate the affected operation"
  description: "Check the rule expression, its units, labels, and collection health."
  impact: "Document the affected user operation before paging."
  action: "Use the owning team's reviewed runbook; do not scale resources blindly."
  runbook_url: "https://example.com/runbooks/replace-with-reviewed-runbook"
告警路由与升级
路由策略
告警应根据各种条件投递给合适的接收者:
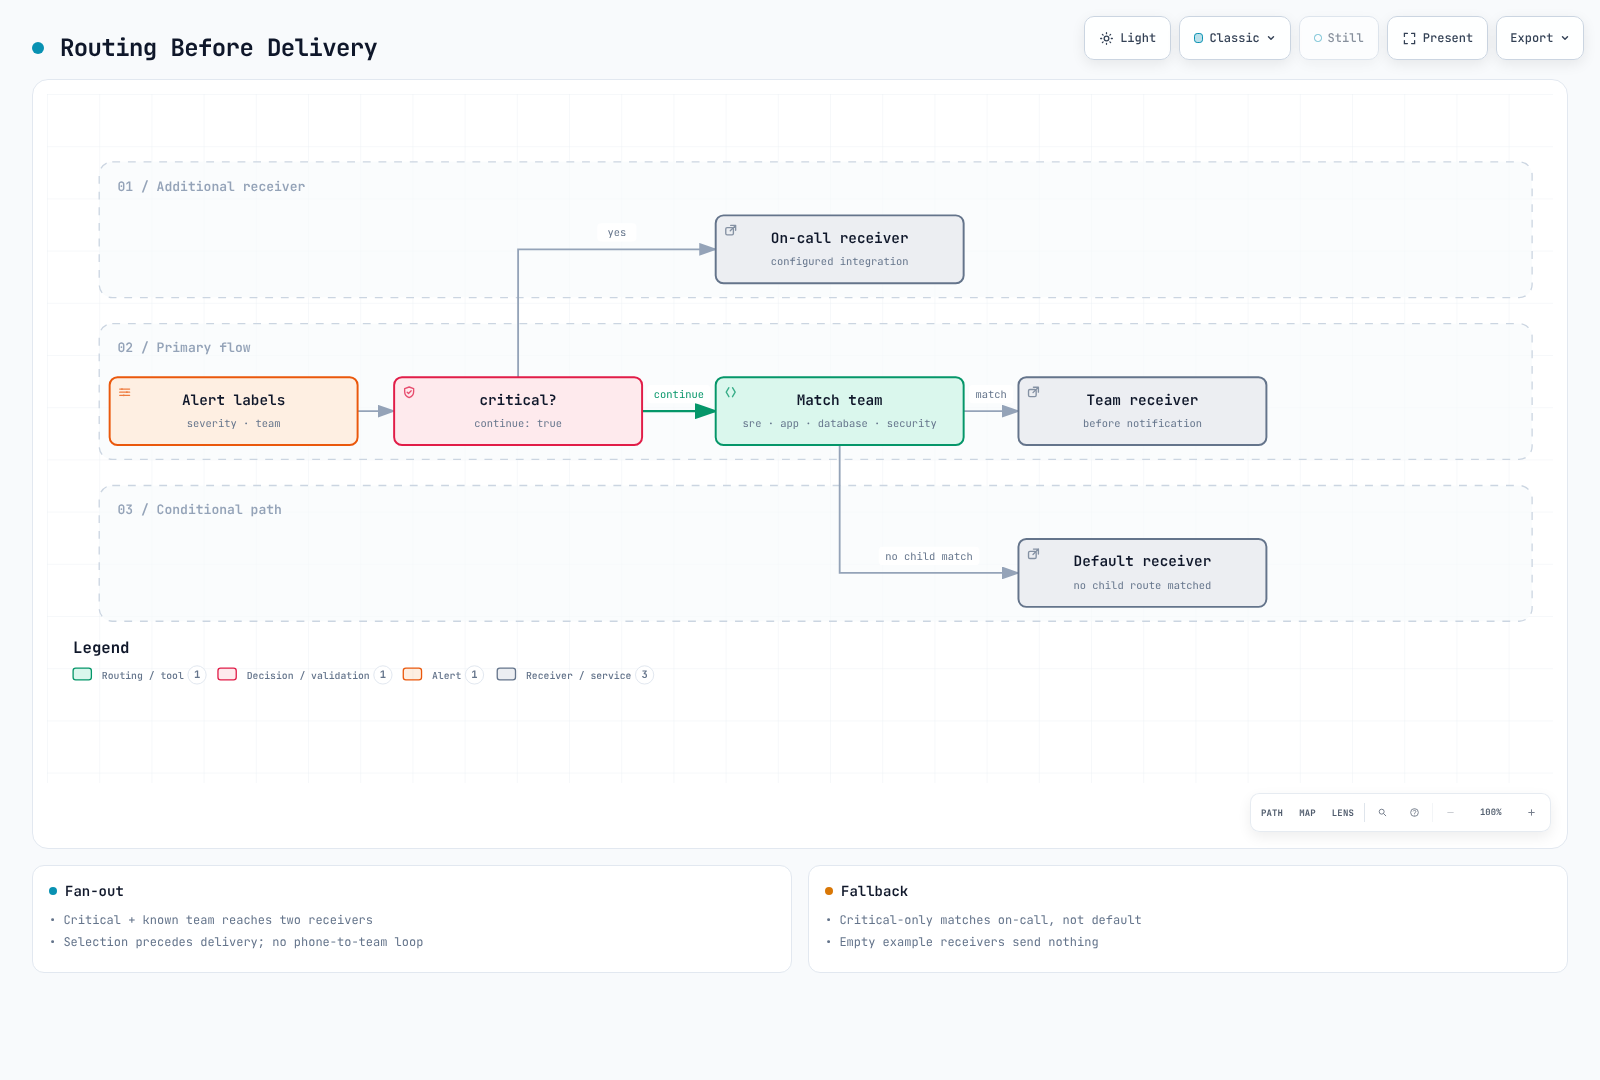
路由树设计
这是一份完整的不发送通知的路由验证配置。其中空的 receiver 是有意为之;在用于生产之前,请配置经过审阅的集成和 Secret 文件。critical 告警会同时分发给 on-call receiver 和匹配的团队。缺少 team 标签时会回退到 default,但仅匹配 critical 的情况不会同时调用 default。由于存在分组延迟,因此不存在"立即电话呼叫"的保证。disk critical 仅对相同的 instance/device/mountpoint 抑制 warning。
route:
  receiver: default-receiver
  group_by: [alertname, cluster, namespace, service]
  group_wait: 30s
  group_interval: 5m
  repeat_interval: 4h
  routes:
    - matchers: ['severity="critical"']
      receiver: critical-oncall
      continue: true
    - matchers: ['team="sre"']
      receiver: sre-team
    - matchers: ['team="app"']
      receiver: dev-team
    - matchers: ['team="database"']
      receiver: dba-team
    - matchers: ['team="security"']
      receiver: security-team
receivers:
  - name: default-receiver
  - name: critical-oncall
  - name: sre-team
  - name: dev-team
  - name: dba-team
  - name: security-team
inhibit_rules:
  - source_matchers: ['alertname="DiskSpaceCritical"', 'instance!=""', 'device!=""', 'mountpoint!=""']
    target_matchers: ['alertname="DiskSpaceWarning"', 'instance!=""', 'device!=""', 'mountpoint!=""']
    equal: [cluster, instance, device, mountpoint]
升级策略
以下内容为示例。请在 on-call 服务中配置时区、确认时间窗、备份人员和重新呼叫行为,并通过演练进行测试:
| 步骤 | 时间 | 目标 | 渠道 |
|---|---|---|---|
| 1 | 0 分钟 | 主 on-call | Slack, PagerDuty |
| 2 | 15 分钟 | 副 on-call | Slack, PagerDuty, SMS |
| 3 | 30 分钟 | 团队负责人 | Slack, PagerDuty, Phone |
| 4 | 45 分钟 | 工程经理 | Phone |
| 5 | 60 分钟 | CTO/工程 VP | Phone |
On-Call 轮值
On-Call 概念
On-Call 指在指定时间段内负责处理系统问题的指定响应者。
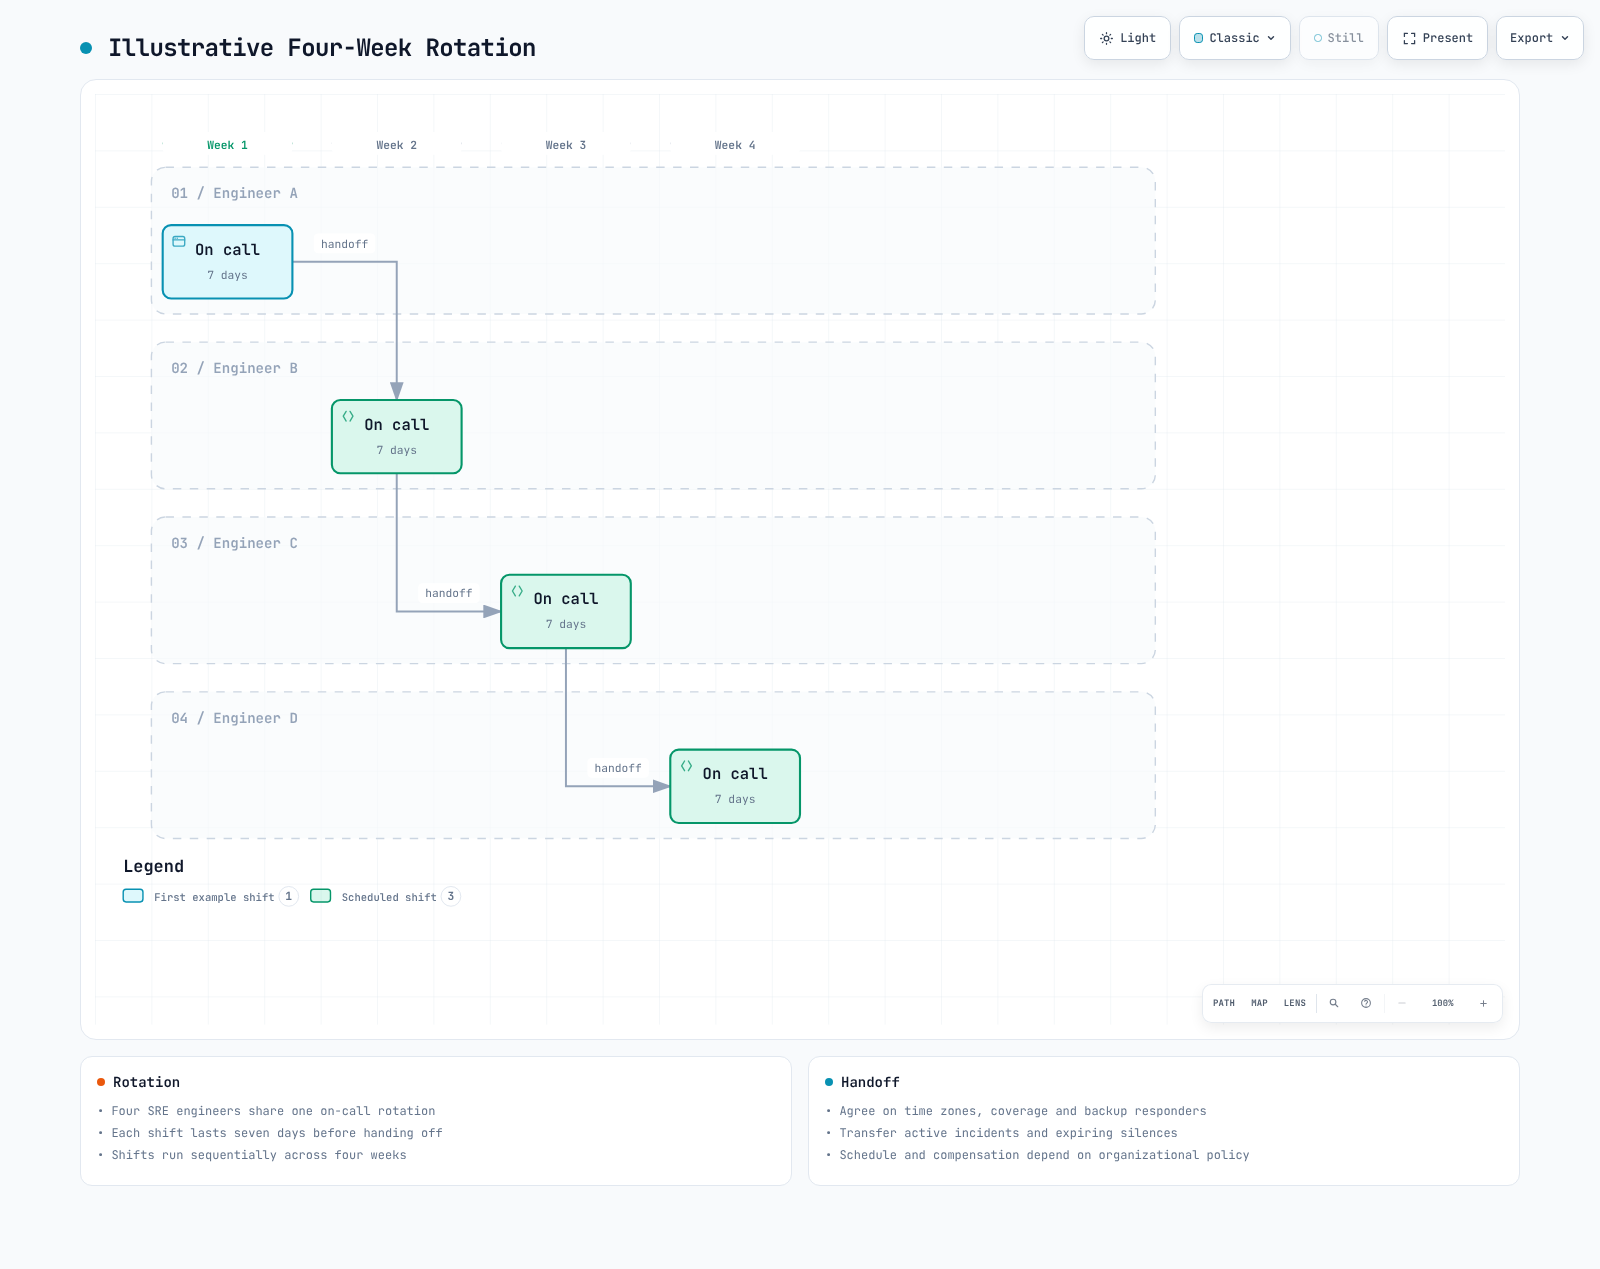
On-Call 最佳实践
- 明确的交接排班:每周或每两周轮换
- 交接流程:换班时移交进行中的问题
- 备份响应者:主响应者不可用时由备份接手
- 合理的补偿:on-call 津贴或补休
- 防止倦怠:合理的轮换周期
On-Call 工具需求
- 排班管理:日历集成、班次管理
- 临时替班(Override):临时变更响应者
- 升级:自动升级
- 移动端支持:随时随地接收告警
- 报告:on-call 活动分析
EKS 环境的告警策略
EKS 特有的告警领域
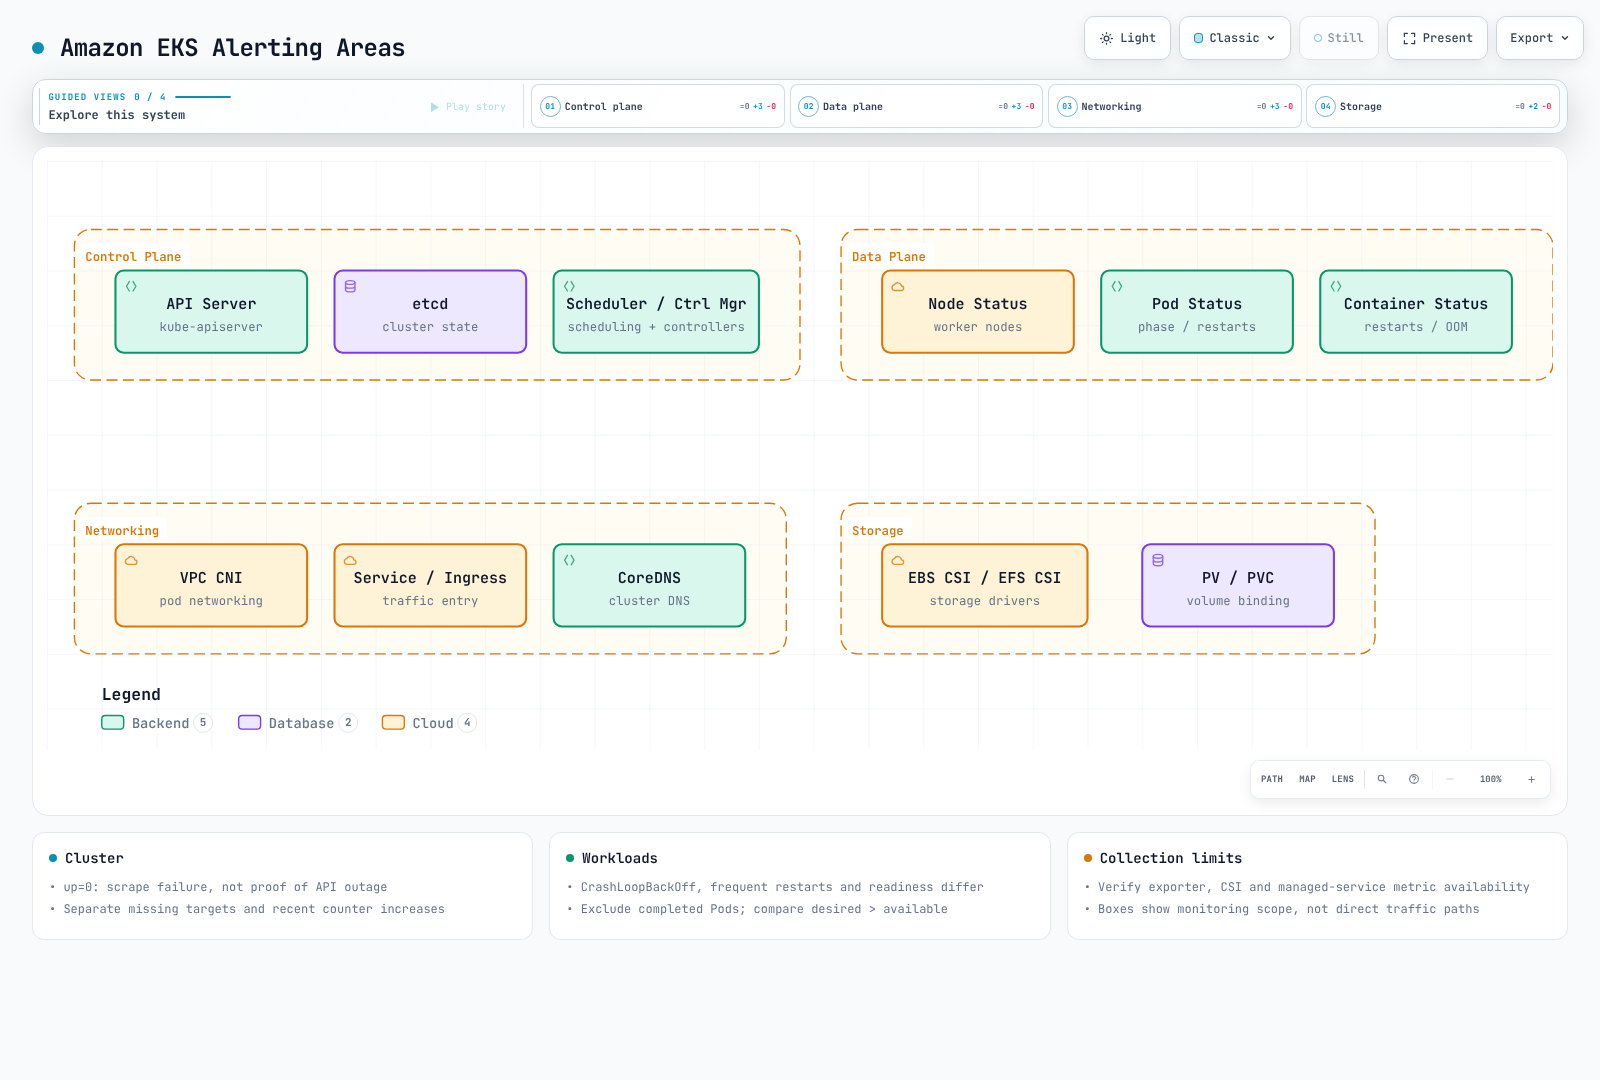
按层次划分的告警策略
1. 集群级告警
请将 job 名称替换为实际部署的目标。up=0 证明的是抓取(scrape)失败,而非 API 完全中断。absent 规则仅覆盖一个采集范围;多集群环境需要预期目标清单和 cluster 标签。对 Cluster Autoscaler 的累计错误计数器应使用 increase。近期的增长在五分钟内持续存在,并不意味着错误在这五分钟内连续发生。该规则不能原样适用于 Karpenter 或 EKS Auto Mode。
groups:
  - name: eks-cluster
    rules:
      - alert: EKSAPIServerScrapeFailed
        expr: up{job="kubernetes-apiservers"} == 0
        for: 1m
        labels:
          severity: critical
          team: sre
        annotations:
          summary: "Prometheus cannot scrape the configured API server target"
      - alert: EKSAPIServerTargetMissing
        expr: absent(up{job="kubernetes-apiservers"})
        for: 5m
        labels:
          severity: warning
          team: sre
        annotations:
          summary: "No API server target series in this Prometheus"
      - alert: EKSNodeNotReady
        expr: kube_node_status_condition{condition="Ready",status="true"} == 0
        for: 5m
        labels:
          severity: critical
          team: sre
        annotations:
          summary: "Node {{ $labels.node }} is not ready"
      - alert: EKSClusterAutoscalerRecentErrors
        expr: increase(cluster_autoscaler_errors_total[10m]) > 0
        for: 5m
        labels:
          severity: warning
          team: sre
        annotations:
          summary: "Cluster Autoscaler recorded failed loops in the last 10 minutes"
2. 工作负载级告警
CrashLoopBackOff 时间序列可能在重试之间短暂消失。该规则在最近五分钟的观察窗口持续有数据达十分钟后触发。它检测的是反复出现的观察结果,而非当前持续处于 Waiting 状态,并且在最后一次观察之后最多可保持激活五分钟。原生规则测试能够区分短暂瞬时状态、反复重试和恢复。
groups:
  - name: eks-workloads
    rules:
      - alert: PodCrashLooping
        expr: max_over_time(kube_pod_container_status_waiting_reason{reason="CrashLoopBackOff"}[5m]) >= 1
        for: 10m
        labels:
          severity: warning
          team: app
        annotations:
          summary: "Pod {{ $labels.namespace }}/{{ $labels.pod }} repeatedly observed in CrashLoopBackOff"
      - alert: PodFrequentRestarts
        expr: increase(kube_pod_container_status_restarts_total[15m]) > 3
        for: 5m
        labels:
          severity: warning
          team: app
        annotations:
          summary: "Pod {{ $labels.namespace }}/{{ $labels.pod }} has frequent restarts"
      - alert: PodNotReady
        expr: |
          (kube_pod_status_ready{condition="true"} == 0)
          and on (namespace, pod, uid)
          (kube_pod_status_phase{phase=~"Pending|Running|Unknown"} == 1)
        for: 15m
        labels:
          severity: warning
          team: app
        annotations:
          summary: "Active pod {{ $labels.namespace }}/{{ $labels.pod }} is not ready"
      - alert: DeploymentReplicasMismatch
        expr: |
          kube_deployment_spec_replicas
            > on (namespace, deployment) kube_deployment_status_replicas_available
        for: 10m
        labels:
          severity: warning
          team: app
        annotations:
          summary: "Deployment {{ $labels.namespace }}/{{ $labels.deployment }} has fewer available replicas than desired"
3. 资源级告警
CFS 示例衡量的是被限流的周期数 / 总周期数,而不是所占用时间的比例。请确认 cAdvisor 会导出这些指标。未设置内存上限时可能显示为零或一个非常大的值;应将内存规则限定于显式设置了 limits 的容器。PVC 统计信息取决于 CSI 驱动和卷类型。分母为零的情况已被排除,但指标缺失并不能证明系统健康。
groups:
  - name: eks-resources
    rules:
      - alert: ContainerCPUThrottling
        expr: |
          (
            sum by (namespace, pod, container) (
              rate(container_cpu_cfs_throttled_periods_total{container!="",container!="POD"}[5m]))
            / sum by (namespace, pod, container) (
              rate(container_cpu_cfs_periods_total{container!="",container!="POD"}[5m]))
          ) > 0.25
          and sum by (namespace, pod, container) (
            rate(container_cpu_cfs_periods_total{container!="",container!="POD"}[5m])) > 0
        for: 5m
        labels:
          severity: warning
          team: app
        annotations:
          summary: "More than 25% of CFS periods throttled for {{ $labels.pod }}/{{ $labels.container }}"
      - alert: ContainerMemoryNearLimit
        expr: |
          (
            container_memory_working_set_bytes{container!="",container!="POD"}
            / container_spec_memory_limit_bytes{container!="",container!="POD"}
          ) > 0.9
          and container_spec_memory_limit_bytes{container!="",container!="POD"} > 0
        for: 5m
        labels:
          severity: warning
          team: app
        annotations:
          summary: "Container {{ $labels.pod }}/{{ $labels.container }} memory is near its reported limit"
      - alert: PVCAlmostFull
        expr: |
          (kubelet_volume_stats_used_bytes / kubelet_volume_stats_capacity_bytes > 0.85)
          and kubelet_volume_stats_capacity_bytes > 0
        for: 5m
        labels:
          severity: warning
          team: sre
        annotations:
          summary: "PVC {{ $labels.namespace }}/{{ $labels.persistentvolumeclaim }} is almost full"
AWS 服务集成告警
EKS 1.28+ 在 AWS/EKS 中提供部分控制平面指标;这并不会将每个内部组件都开放供抓取。若要排查认证错误,需单独启用控制平面日志。评估可用性时应结合采集健康状况、API 请求失败情况以及外部探测:
| AWS 服务 | 监控项 | 告警工具 |
|---|---|---|
| EKS Control Plane | API Server 可用性、认证错误 | CloudWatch |
| EC2 (Nodes) | 实例状态、系统检查 | CloudWatch |
| EBS | 卷状态、IOPS 使用率 | CloudWatch |
| EFS | 吞吐量、连接数 | CloudWatch |
| ALB / NLB | ALB HTTP 请求/错误/响应时间;NLB 流量/TCP 重置/目标健康状况 | CloudWatch:使用各产品专属指标 |
| VPC / NAT Gateway | NAT 指标;单独启用的 Flow Logs 中的接受/拒绝记录 | CloudWatch 指标/Logs;Flow Logs 不是告警引擎 |
方案对比
主流告警方案对比表
| 产品 | 作用与运维限制 |
|---|---|
| Alertmanager | 开源的分组、路由、抑制与提醒;需自行托管和运维。不提供 on-call 排班或基于确认的升级 |
| CloudWatch Alarms | 评估 AWS 指标/受支持的查询,改变状态并调用已配置的操作;排班需单独处理 |
| Grafana OnCall OSS | 已于 2026-03-24 归档;不适合作为新生产部署的默认选择 |
| Grafana Cloud IRM / PagerDuty | on-call/升级的候选方案;请确认当前的套餐、渠道、区域和合同 |
| Opsgenie | 2025-06-04 停止销售;支持与服务计划于 2027-04-05 终止。现有用户需要制定迁移计划 |
方案选择指南
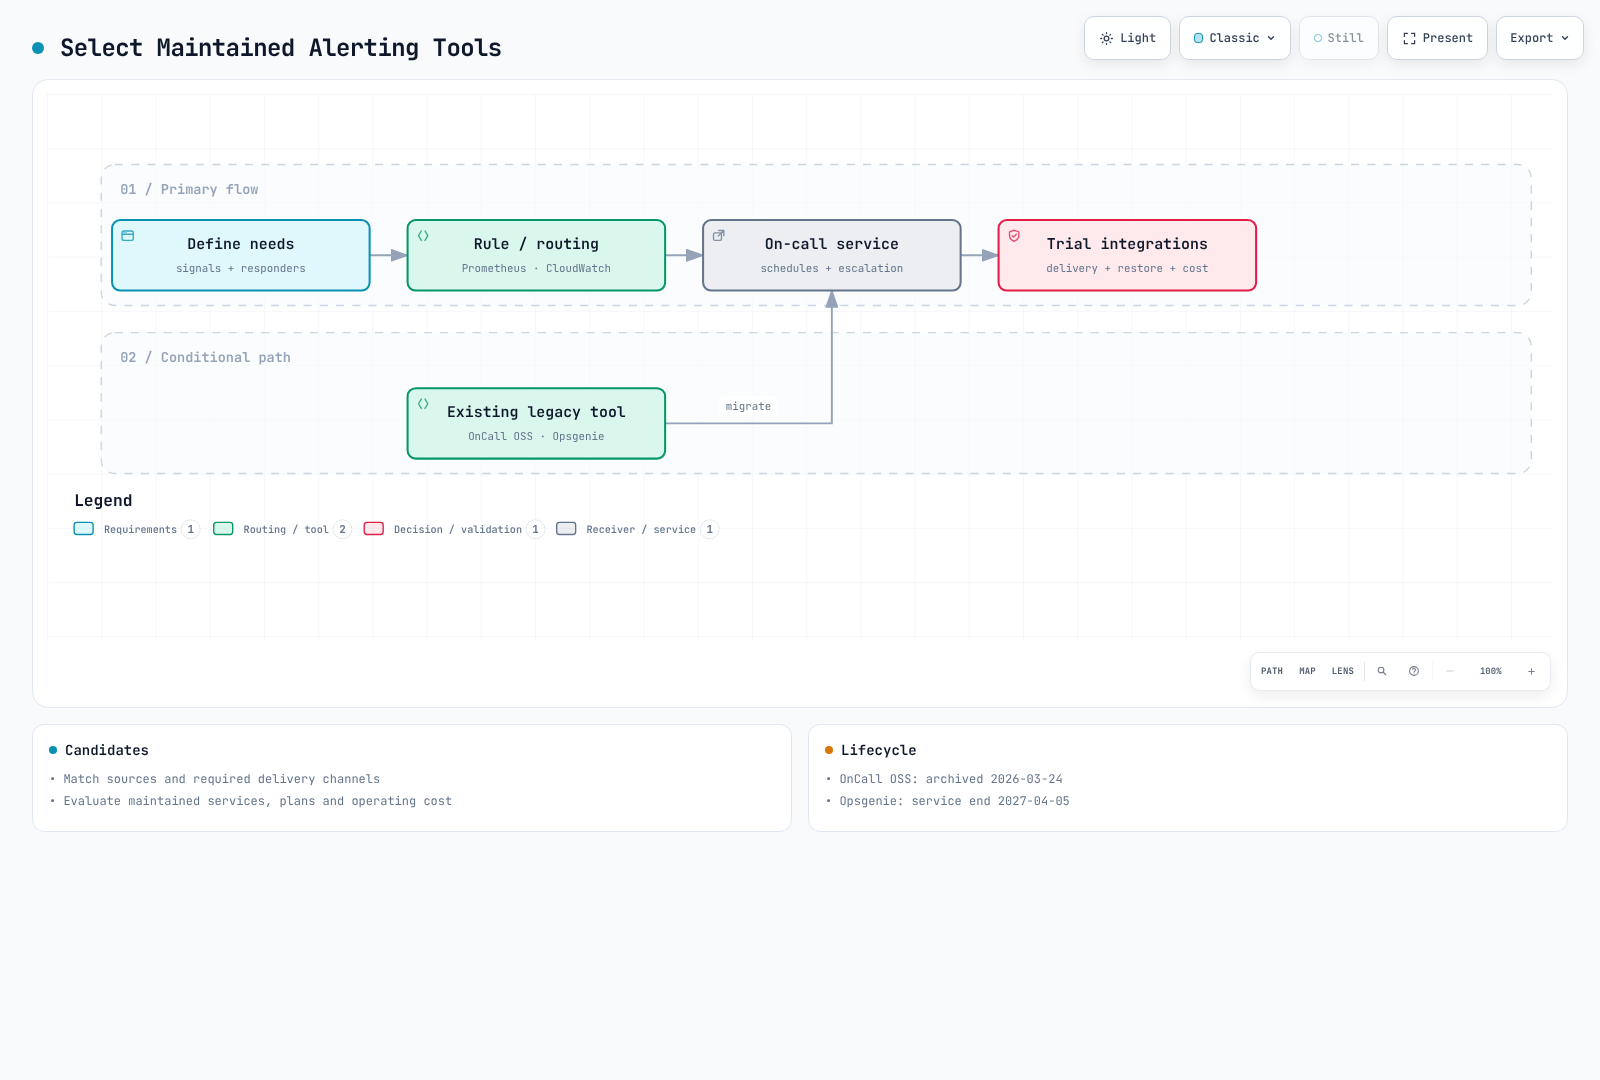
按场景推荐的方案
- 以 Prometheus 为中心:使用 Alertmanager 进行分组/路由,并接入所需的渠道。
- 以 AWS 指标为中心:评估配合 SNS 或受支持的事故集成使用 CloudWatch Alarms。
- 全天候响应:根据人员配置、备份、时区、确认、升级和成本,选择一个仍在维护的 on-call 服务。
- 已有 Grafana OnCall OSS/Opsgenie:确认功能、历史记录、排班和集成的迁移方案。
混合方案
各方案可以组合使用。CloudWatch 不会自动直接发送到 Alertmanager。本示例通过 SNS/受支持的集成对接 on-call 服务;若要经由 Alertmanager 路由,则需要单独设计适配器、认证以及重复/解决状态的处理:
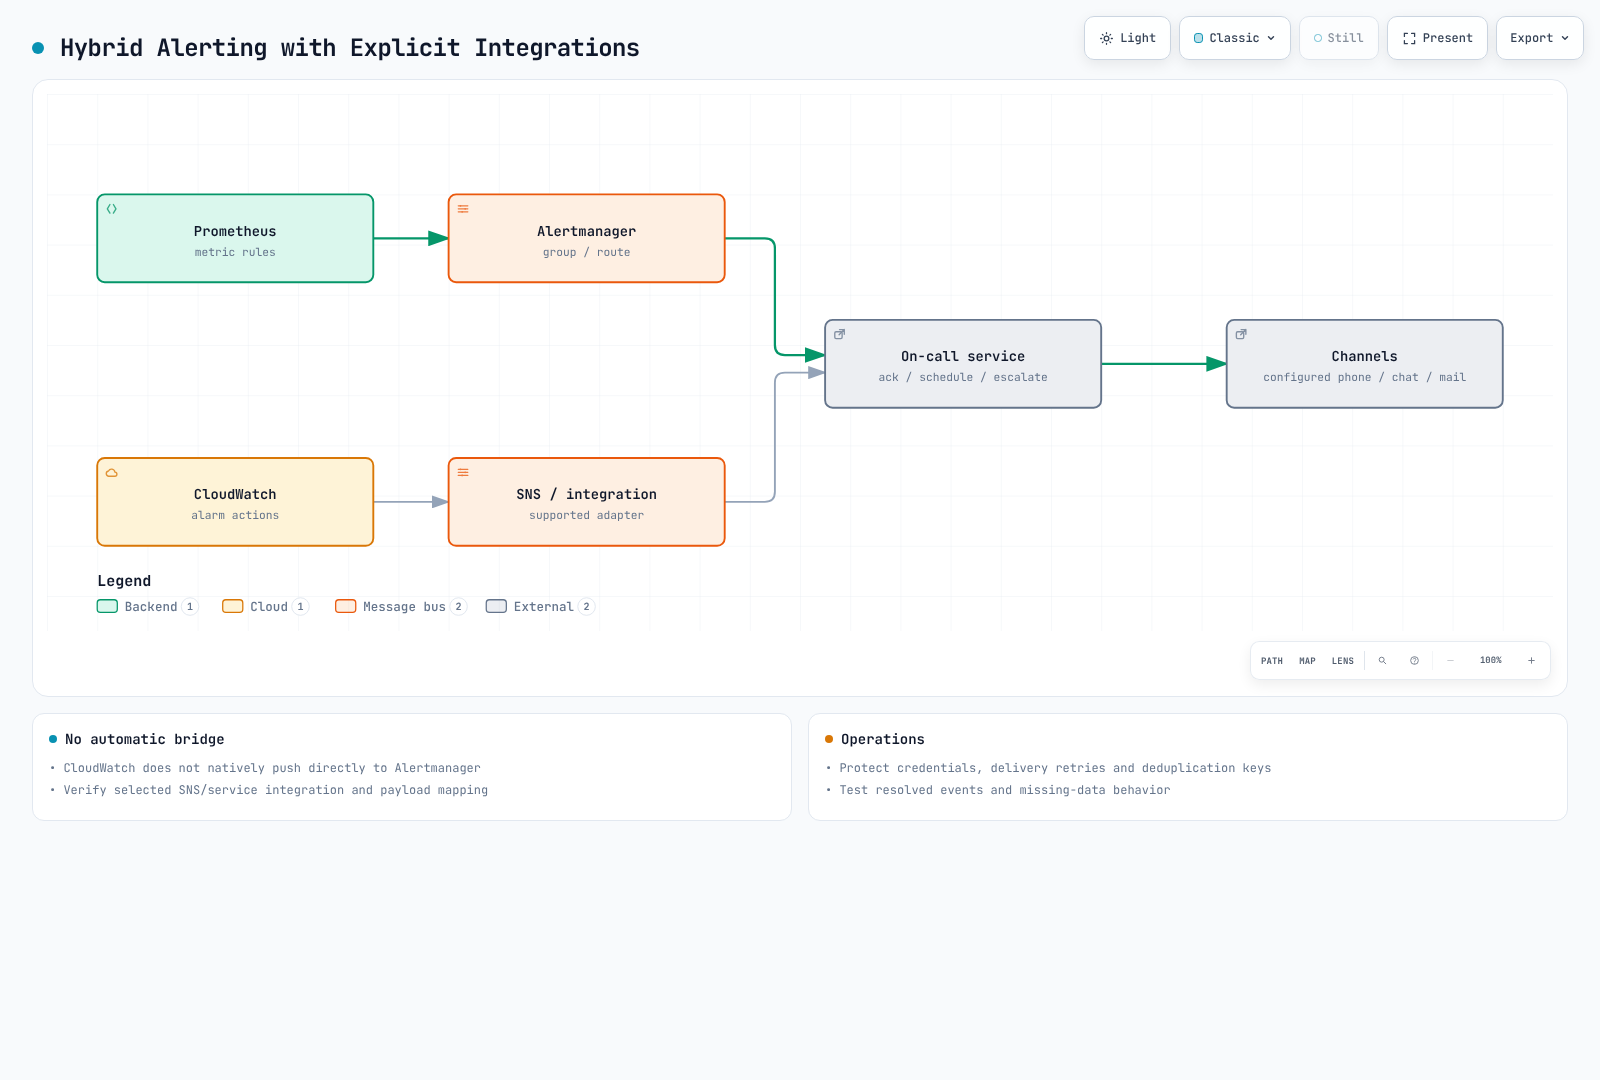
架构示例:
- Prometheus + Alertmanager:指标采集与主要告警处理
- CloudWatch:AWS 服务指标采集
- 仍在维护的 on-call 服务:on-call 管理与升级
- Slack:实时告警与协作
下一步
本节介绍了告警的基本概念与策略。各方案的详细配置方法请参考以下文档:
- Prometheus Alertmanager: 开源告警管理
- CloudWatch Alarms: AWS 原生告警
- Grafana OnCall: 现有部署的评估与迁移注意事项