Istio 仪表板
审查基线:Istio 1.31;下文限定说明 Kiali 兼容性。 最后更新:2026 年 9 月 11 日
使用 Grafana、Kiali 和 Prometheus 检查已配置遥测。示例是依据官方参考及离线验证检查的实验配置模式;未部署或进行生产负载测试。后端可用性、身份验证、命名空间权限、存储和版本兼容性是明确前提条件。
目录
仪表板概述
可观测性技术栈架构
Kiali 从 Kubernetes API 读取 Istio 资源并查询 Prometheus;istiod 配置代理,不向 Kiali 推送配置。Grafana 查询已配置指标/日志/追踪后端。Prometheus 抓取代理指标,Collector 交付访问日志/span,追踪应用必须传播上下文。
各工具用途
| 工具 | 主要用途 | 数据源 |
|---|---|---|
| Kiali | 服务拓扑、流量分析、配置验证 | Prometheus、Istio 配置 |
| Grafana | 指标可视化、警报、日志分析 | Prometheus、Loki、Tempo |
| Prometheus | 指标采集和查询 | Envoy、istiod |
| Jaeger | 分布式追踪分析 | Envoy span |
Kiali
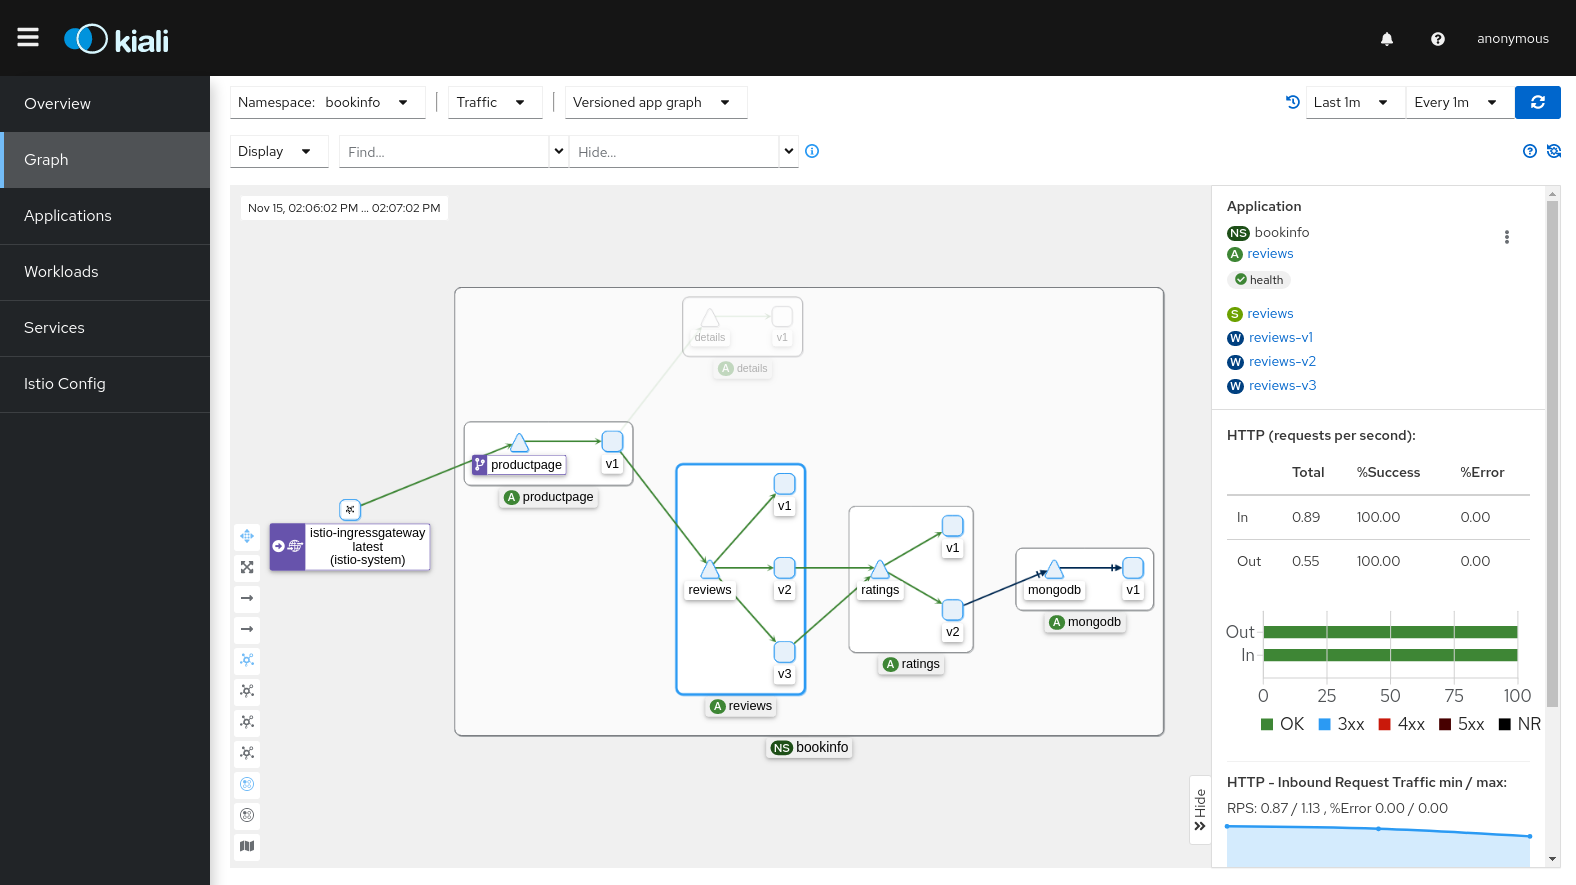
Kiali 是 Istio 服务网格的可观测性控制台。它实时可视化服务拓扑、分析流量并验证 Istio 配置。
Kiali 的核心价值
- 服务图可视化:直观表示微服务间关系和流量
- 实时监控:实时查看请求速率、错误率和响应时间
- 配置验证:检测 VirtualService、DestinationRule 等 Istio CRD 错误
- mTLS 状态验证:直观确认服务间 mTLS 应用情况
- 分布式追踪集成:集成 Jaeger,直接从服务图查看追踪
安装示例和兼容性
Kiali 2.31.0 及其 Operator 于 2026 年 8 月 23 日发布。公布的兼容表目前列出 Istio 1.30 配 Kiali 2.26+、Istio 1.29 配 Kiali 2.21+;尚未明确列出 Istio 1.31。将下文视为文档所述兼容 Istio 部署的 Kiali 2.31 配置示例。使用该组合前,根据当前维护者指导和代表性实验确认 1.31 兼容性;版本号相同或“最新”都不能证明兼容。不要仅为遵循此示例而降级现有网格。
1. 安装 Kiali Operator
helm repo add kiali https://kiali.org/helm-charts
helm repo update kiali
helm install kiali-operator kiali/kiali-operator \
  --namespace kiali-operator --create-namespace --version 2.31.0
kubectl get pods -n kiali-operator
2. 创建范围受限的只读 Kiali CR
必须已有可达且包含 Istio 指标的 Prometheus;其 Service 名不同则调整 URL。后文 Prometheus Operator 示例在 istio-system 定义 prometheus。Operator 授予 Kiali 访问自身命名空间及发现选择器匹配的命名空间。cluster_wide_access: false 时,创建命名空间范围访问,而非授予服务器集群范围访问。终端用户 RBAC 可进一步缩小可见命名空间。
apiVersion: kiali.io/v1alpha1
kind: Kiali
metadata:
  name: kiali
  namespace: istio-system
spec:
  deployment:
    cluster_wide_access: false
    discovery_selectors:
      default:
      - matchExpressions:
        - key: kubernetes.io/metadata.name
          operator: In
          values:
          - default
          - app
          - production
    view_only_mode: true
    replicas: 1
    resources:
      requests:
        cpu: 100m
        memory: 256Mi
      limits:
        cpu: 500m
        memory: 1Gi
  auth:
    strategy: token
  external_services:
    prometheus:
      url: http://prometheus.istio-system.svc.cluster.local:9090
    grafana:
      enabled: false
    tracing:
      enabled: false
保存为 kiali-cr.yaml 后应用。协调前创建目标应用命名空间。Kiali 不自动继承 Istio 发现选择器。旧 accessible_namespaces 字段在 Kiali 2.0 移除。后端 Grafana/追踪集成在端点、凭证和兼容性配置前禁用。
kubectl apply -f kiali-cr.yaml
kubectl get kiali,pods -n istio-system
kubectl port-forward -n istio-system svc/kiali 20001:20001
外部访问需单独配置持续维护的 Ingress/网关、TLS 证书、身份验证和浏览器可达 URL。示例不安装入口控制器、cert-manager 签发者或公共端点。代理状态功能可能依赖 istiod 调试 API;若有意禁用,设置 external_services.istio.istio_api_enabled: false 并接受功能限制,不要假定所有视图可用。
访问 Kiali
端口转发后打开 http://localhost:20001。Token 身份验证使用 Kubernetes ServiceAccount 令牌,遵循账户命名空间权限。使用具有预期 RBAC 的专用查看者身份;不要为方便管理员登录而使用 Kiali 服务器/Operator ServiceAccount。对于已创建且正确绑定的账户:
kubectl create token kiali-viewer -n default --duration=1hAPI 服务器决定实际令牌寿命。Token 策略支持单集群。多集群/OIDC 部署需要文档规定的身份验证设置、注册重定向 URI 和命名空间授权;仅客户端 ID 与签发者 URL 不是完整生产配置。参阅 Kiali 前提条件和命名空间管理。
Kiali 主要功能
1. 服务图(Graph)
概述:
- 按命名空间可视化服务拓扑
- 展示流量和请求速率(RPS)
- 可视化错误率和响应时间
- 验证各版本流量分布
流量动画表示选定时间窗口和刷新间隔内的聚合流量。它不是抓包,也不是每个点代表一次请求。定量分析使用连线指标。
图视图类型:
| 视图类型 | 描述 | 使用场景 |
|---|---|---|
| 应用图 | 应用级 | 理解服务依赖 |
| 版本化应用图 | 按版本展示应用 | 金丝雀部署监控 |
| 工作负载图 | 工作负载级 | Deployment/StatefulSet 级分析 |
| 服务图 | 服务级 | 以 Kubernetes Service 为中心的视图 |
图过滤选项:
# Edge label display
- Request percentage: Traffic distribution rate (%)
- Request rate: Request rate (RPS)
- Response time: Selected latency statistic
- Throughput: Throughput (bytes/sec)

# Display options
- Traffic Animation: Real-time traffic flow
- Service Nodes: Show service nodes
- Traffic Distribution: Version-based traffic distribution
- Security: mTLS lock icon
- Circuit Breakers: Circuit breaker status
- Virtual Services: VirtualService icon查找/隐藏功能:
# Find slow edges
Find: response time > 1s
Expression: rt > 1000

# Find unhealthy nodes
Find: unhealthy nodes
Expression: ! healthy

# Hide specific services
Hide: kube-system namespace
2. 应用视图
各应用的详细信息:
- 概述:总体状态摘要
- 流量:入站/出站流量指标
- 请求量(RPS)
- 请求持续时间(P50、P95、P99)
- 请求大小 / 响应大小
- 入站指标:入站流量分析
- 源工作负载
- 请求协议(HTTP/gRPC/TCP)
- 响应码
- 出站指标:出站流量分析
- 目标服务
- 响应时间
- 错误率
3. 工作负载视图
各工作负载(Deployment、StatefulSet 等)的详细信息:
- Pod:Pod 列表和状态
- Service:关联 Service 列表
- 日志:实时 Pod 日志(Envoy + 应用)
- 指标:工作负载指标
- 请求量
- 持续时间(P50/P95/P99)
- 错误率
- 追踪:集成 Jaeger 的分布式追踪
- Envoy:Envoy 配置验证
- 集群
- 监听器
- 路由
- 引导配置
4. 服务视图
各 Kubernetes Service 的详细信息:
- 概述:Service 元数据
- 流量:流量指标
- 入站指标:按客户端分析请求
- 追踪:服务调用追踪
5. Istio 配置验证(Istio Config)
Kiali 使用可用集群状态验证受支持 Istio 资源。只读示例可检查配置;编辑需要单独授权。绿色勾选表示已实现检查通过,不证明运行时正确。
验证目标:
- VirtualService
- DestinationRule
- Gateway
- ServiceEntry
- Sidecar
- PeerAuthentication
- RequestAuthentication
- AuthorizationPolicy
- Telemetry
验证级别:
| 图标 | 级别 | 描述 |
|---|---|---|
| ✅ | 有效 | 可用检查通过 |
| ⚠️ | 警告 | 潜在问题(违反最佳实践) |
| ❌ | 错误 | 检测到配置错误;API 准入仍可能成功 |
验证示例:KIA1107,未找到子集
在 default 命名空间,短主机名 reviews 解析为 reviews.default.svc.cluster.local;仅使用这两种形式不构成主机不匹配。KIA0101 表示 AuthorizationPolicy 引用的命名空间未找到。下方有意错误示例路由到 v2,但仅定义 v1:
apiVersion: networking.istio.io/v1
kind: VirtualService
metadata:
  name: reviews
  namespace: default
spec:
  hosts:
  - reviews.default.svc.cluster.local
  http:
  - route:
    - destination:
        host: reviews.default.svc.cluster.local
        subset: v2
---
apiVersion: networking.istio.io/v1
kind: DestinationRule
metadata:
  name: reviews
  namespace: default
spec:
  host: reviews.default.svc.cluster.local
  subsets:
  - name: v1
    labels:
      version: v1
定义所引用子集并部署匹配服务端点,或路由到目标现有子集。假定两个 Bookinfo 版本都存在,此 DestinationRule 提供两个标签:
apiVersion: networking.istio.io/v1
kind: DestinationRule
metadata:
  name: reviews
  namespace: default
spec:
  host: reviews.default.svc.cluster.local
  subsets:
  - name: v1
    labels:
      version: v1
  - name: v2
    labels:
      version: v2
Kubernetes 可接受存在语义路由错误的清单,因此配置警告/错误不等同于 API 准入失败。
6. 安全
mTLS 状态验证
结合图的安全指示、所选流量窗口及生效 PeerAuthentication 使用。观察到 mTLS 流量不证明明文被禁止:PERMISSIVE 在观测窗口内也可承载全部加密流量。缺失流量/遥测不证明服务安全,仅策略标签也不能确立授权有效性。通过配置及允许/拒绝流量测试确认。
安全仪表板:
- 按命名空间展示 mTLS 状态
- PeerAuthentication 策略应用状态
- AuthorizationPolicy 效果
7. 分布式追踪集成
Kiali 集成 Jaeger,可直接从服务图查看追踪。
使用方法:
- 点击图中的服务节点
- 点击“查看追踪”链接
- 自动跳转到 Jaeger UI,查看该服务追踪
追踪详情:
- Span 持续时间(各服务处理时间)
- 已插桩 span 属性/事件(不会自动捕获标头)
- 错误详情
- 服务依赖图
Kiali 高级功能
流量切换可视化
apiVersion: networking.istio.io/v1
kind: VirtualService
metadata:
  name: reviews-canary
  namespace: default
spec:
  hosts:
  - reviews.default.svc.cluster.local
  http:
  - route:
    - destination:
        host: reviews.default.svc.cluster.local
        subset: v1
      weight: 90
    - destination:
        host: reviews.default.svc.cluster.local
        subset: v2
      weight: 10
---
apiVersion: networking.istio.io/v1
kind: DestinationRule
metadata:
  name: reviews
  namespace: default
spec:
  host: reviews.default.svc.cluster.local
  subsets:
  - name: v1
    labels:
      version: v1
  - name: v2
    labels:
      version: v2
配置权重为 90/10;Kiali 展示选定窗口观测请求速率。采样波动、错误和路由条件可使观测份额不同。示例假定两个子集均有匹配端点。
金丝雀部署监控:
- 各版本观测请求速率与配置 90/10 权重比较
- 各版本错误率比较
- 各版本响应时间(P50、P95、P99)
- 用实时流量动画验证分布
命名空间隔离和访问控制
这是相同 Kiali 实例的替代选择器配置,不是额外重叠部署。禁用集群范围访问后,服务器访问限制为 team-a 加自身控制平面命名空间;用户 RBAC 仍适用。OpenID 设置是独立身份验证任务,现代 Keycloak 默认使用 /realms/...,除非配置自定义 /auth 前缀。
apiVersion: kiali.io/v1alpha1
kind: Kiali
metadata:
  name: kiali
  namespace: istio-system
spec:
  deployment:
    cluster_wide_access: false
    discovery_selectors:
      default:
      - matchLabels:
          kubernetes.io/metadata.name: team-a
    view_only_mode: true
    replicas: 1
    resources:
      requests:
        cpu: 100m
        memory: 256Mi
      limits:
        cpu: 500m
        memory: 1Gi
  auth:
    strategy: token
Grafana 仪表板
官方 Istio 仪表板
下方目录已对照下载的 Istio1.31.0 修订检查,不只是按仪表板标题判断。选择匹配安装 Istio 版本的修订,导入时映射 Prometheus 数据源。仪表板最新修订不自动兼容旧网格。
| 仪表板 | ID | 已验证修订 | 范围 |
|---|---|---|---|
| Istio Mesh | 7639 | 330 | 全局流量、成功/4xx/5xx、工作负载概述和组件版本 |
| Istio Service | 7636 | 329 | 客户端/服务器流量、持续时间、大小、TCP 流量及源/目标工作负载 |
| Istio Workload | 7630 | 330 | 工作负载入站/出站 HTTP 和 TCP 指标 |
| Istio Performance | 11829 | 329 | 代理/istiod vCPU、内存、磁盘、数据速率和 goroutine |
| Istio Control Plane | 7645 | 329 | 资源、xDS 推送/错误/时序、验证和注入 webhook |
| Istio Wasm Extension | 13277 | 287 | Wasm VM/运行时/缓存/远程加载状态 |
| Istio Ztunnel | 21306 | 97 | Ambient L4 连接、字节、DNS、xDS 和进程资源 |
Service 仪表板的 service 变量是服务主机,其 1.31 修订具有 srcns/dstns 过滤器,不是通用 namespace 变量。Workload 仪表板有 namespace 和 workload。配置深层链接前检查下载修订的变量。ID7636、11829、13277 分别是 Service、Performance 和 Wasm,不是 Workload、通用 Mesh 和 Gateway。
通过 Grafana 仪表板 UI 导入并选择数据源。全新测试环境可使用 Istio 固定的 samples/addons/grafana.yaml,其中捆绑仪表板;该示例未针对生产加固。现有部署使用其文档规定的预置机制,不要安装第二个 Grafana。
社区 Loki 仪表板 14876
已验证目录条目为 Grafana Loki Dashboard for Istio Service Mesh,修订 3。它对特定 Envoy 文本格式使用 pattern 解析器,包含 status_code、req_id 及 datasource/label/job/instance 变量。面板包括请求/状态计数、字节、近期请求、持续时间及访客/路径/user-agent 摘要。它不确立 mTLS 安全,也不提供此前声称的每个面板。
curl -fL -o istio-loki-dashboard.json \
  https://grafana.com/api/dashboards/14876/revisions/3/download
审核文件后,通过 UI 导入并绑定 Loki 数据源。创建带标签 ConfigMap 不会解析数据源输入或安装仪表板加载器。此社区修订不直接兼容本指南 JSON 提供程序/Alloy 标签。该格式应使用日志章节已检查仪表板和查询,或显式调整解析器、字段和标签。日志派生统计描述保留日志,可因过滤/采样而有偏。
指标警报规则
以下是 Prometheus Operator PrometheusRule,不是 Grafana 管理的警报预置。Grafana 管理规则使用 query-data/condition/UID 字段;选择该路径时在 Grafana 配置并导出受支持格式。下方 Operator 选择 istio-system 中规则。阈值是需按 SLO 和流量调整的示例;HTTP5xx 不是 gRPC/应用失败的完整定义。
apiVersion: monitoring.coreos.com/v1
kind: PrometheusRule
metadata:
  name: istio-alerts
  namespace: istio-system
spec:
  groups:
  - name: istio-service-alerts
    rules:
    - alert: HighErrorRate
      expr: sum by (destination_service_name, destination_service_namespace) (rate(istio_requests_total{reporter="destination",response_code=~"5.."}[5m]))
        / sum by (destination_service_name, destination_service_namespace) (rate(istio_requests_total{reporter="destination"}[5m]))
        > 0.05
      for: 2m
      labels:
        severity: warning
      annotations:
        summary: High HTTP error fraction for {{ $labels.destination_service_name }}
        description: Error fraction is {{ $value | humanizePercentage }}
    - alert: HighLatency
      expr: histogram_quantile(0.95, sum by (destination_service_name, destination_service_namespace,
        le) (rate(istio_request_duration_milliseconds_bucket{reporter="destination"}[5m]))) > 1000
      for: 5m
      labels:
        severity: warning
      annotations:
        summary: P95 HTTP duration exceeds1000ms
    - alert: UpstreamOverflow
      expr: sum by (destination_service_name, destination_service_namespace) (rate(istio_requests_total{response_flags=~".*UO.*",reporter="source"}[5m]))
        > 0
      for: 1m
      labels:
        severity: warning
      annotations:
        summary: Source proxy reports upstream overflow
    - alert: PlaintextMeshTraffic
      expr: sum by (source_workload, source_workload_namespace, destination_workload, destination_workload_namespace)
        (rate(istio_requests_total{connection_security_policy="none",reporter="destination"}[5m])) > 0
      for: 5m
      labels:
        severity: warning
      annotations:
        summary: Observed plaintext traffic; inspect intended PeerAuthentication
错误表达式保持比例,因此 humanizePercentage 可正确展示。对于可能从未到达目标的上游溢出,使用源报告。缺失明文指标不证明 STRICT 执行。
Prometheus
Prometheus Operator 实验配置
此处假定单独安装兼容 Prometheus Operator/CRD,且 EKS EC2 节点上有正常 gp3 StorageClass(或其他平台适当类)。它不安装 Operator、不预置 EBS,也不配置生产存储/高可用设计。内存/CPU/存储值是示意。使用此部署或现有 Prometheus,不要重复抓取技术栈。
下方 ServiceMonitor、PodMonitor 和 PrometheusRule 选择器默认匹配此 CR 命名空间中全部对应资源。因此包含指标章节的监控器,后者未带旧示例中不匹配的标签。监控资源选择与各监控器发现的工作负载命名空间是独立设置。下方 RBAC 用于 Kubernetes 目标发现;其他抓取类型可能需要不同权限。
apiVersion: v1
kind: ServiceAccount
metadata:
  name: prometheus-istio
  namespace: istio-system
---
apiVersion: rbac.authorization.k8s.io/v1
kind: ClusterRole
metadata:
  name: prometheus-istio-discovery
rules:
- apiGroups:
  - ''
  resources:
  - services
  - endpoints
  - pods
  verbs:
  - get
  - list
  - watch
- apiGroups:
  - discovery.k8s.io
  resources:
  - endpointslices
  verbs:
  - get
  - list
  - watch
---
apiVersion: rbac.authorization.k8s.io/v1
kind: ClusterRoleBinding
metadata:
  name: prometheus-istio-discovery
roleRef:
  apiGroup: rbac.authorization.k8s.io
  kind: ClusterRole
  name: prometheus-istio-discovery
subjects:
- kind: ServiceAccount
  name: prometheus-istio
  namespace: istio-system
---
apiVersion: monitoring.coreos.com/v1
kind: Prometheus
metadata:
  name: istio
  namespace: istio-system
spec:
  replicas: 1
  retention: 15d
  retentionSize: 50GB
  serviceAccountName: prometheus-istio
  podMetadata:
    labels:
      monitoring-stack: istio
  serviceMonitorSelector: {}
  podMonitorSelector: {}
  ruleSelector: {}
  resources:
    requests:
      cpu: 1000m
      memory: 4Gi
    limits:
      cpu: 2000m
      memory: 8Gi
  storage:
    volumeClaimTemplate:
      spec:
        accessModes:
        - ReadWriteOnce
        resources:
          requests:
            storage: 100Gi
        storageClassName: gp3
---
apiVersion: v1
kind: Service
metadata:
  name: prometheus
  namespace: istio-system
spec:
  selector:
    monitoring-stack: istio
  ports:
  - name: http
    port: 9090
    targetPort: 9090
  type: ClusterIP
长期存储仅在部署并保护目的地后合并远程写入块。下方 URL 假定 observability 中有 VictoriaMetrics Service;按实际后端调整。两个 Prometheus 副本抓取相同目标,因此远程存储需要明确高可用/去重设计和副本标签。仅将 replicas 改为 2 不会让远程指标求和正确。在目标环境验证持久化、故障行为和容量。
spec:
  remoteWrite:
  - url: http://victoria-metrics.observability.svc.cluster.local:8428/api/v1/write
    queueConfig:
      capacity: 10000
      maxShards: 5
      minShards: 1
      maxSamplesPerSend: 5000
Prometheus 查询示例
黄金信号
延迟以毫秒计。饱和度示例展示活动连接和断路器状态 gauge;没有标准 cx_max 指标可自动作为利用率分母。
# 1. Latency
histogram_quantile(0.95,
  sum(rate(istio_request_duration_milliseconds_bucket{
    reporter="destination"
  }[5m])) by (destination_service_name, destination_service_namespace, le)
)

# 2. Traffic
sum(rate(istio_requests_total{reporter="destination"}[1m])) by (destination_service_name, destination_service_namespace)

# 3. Errors (error rate)
sum(rate(istio_requests_total{response_code=~"5..", reporter="destination"}[5m])) by (destination_service_name, destination_service_namespace)
/
sum(rate(istio_requests_total{reporter="destination"}[5m])) by (destination_service_name, destination_service_namespace)
* 100

# 4. Saturation
envoy_cluster_upstream_cx_active
envoy_cluster_circuit_breakers_default_cx_open
创建自定义仪表板
Grafana 仪表板 JSON 模板
这是用于导入/文件预置的经典仪表板对象。提供现有 prometheus 数据源 UID。每个面板过滤命名空间和服务;按来源的表还保留源命名空间。
{
  "title": "Custom Istio Service Dashboard",
  "tags": [
    "istio",
    "custom"
  ],
  "timezone": "browser",
  "version": 1,
  "panels": [
    {
      "id": 1,
      "title": "Request Rate",
      "type": "timeseries",
      "gridPos": {
        "h": 8,
        "w": 12,
        "x": 0,
        "y": 0
      },
      "targets": [
        {
          "expr": "sum(rate(istio_requests_total{reporter=\"destination\",destination_service_namespace=\"$namespace\",destination_service_name=\"$service\"}[5m])) by (response_code)",
          "legendFormat": "{{ response_code }}",
          "refId": "A",
          "datasource": {
            "type": "prometheus",
            "uid": "prometheus"
          }
        }
      ],
      "fieldConfig": {
        "defaults": {
          "color": {
            "mode": "palette-classic"
          },
          "custom": {
            "drawStyle": "line",
            "lineInterpolation": "linear",
            "fillOpacity": 10
          },
          "unit": "reqps"
        }
      },
      "datasource": {
        "type": "prometheus",
        "uid": "prometheus"
      }
    },
    {
      "id": 2,
      "title": "P95 Latency",
      "type": "gauge",
      "gridPos": {
        "h": 8,
        "w": 6,
        "x": 12,
        "y": 0
      },
      "targets": [
        {
          "expr": "histogram_quantile(0.95, sum(rate(istio_request_duration_milliseconds_bucket{reporter=\"destination\",destination_service_namespace=\"$namespace\",destination_service_name=\"$service\"}[5m])) by (le))",
          "refId": "A",
          "datasource": {
            "type": "prometheus",
            "uid": "prometheus"
          }
        }
      ],
      "fieldConfig": {
        "defaults": {
          "unit": "ms",
          "thresholds": {
            "mode": "absolute",
            "steps": [
              {
                "value": 0,
                "color": "green"
              },
              {
                "value": 500,
                "color": "yellow"
              },
              {
                "value": 1000,
                "color": "red"
              }
            ]
          },
          "max": 2000
        }
      },
      "options": {
        "showThresholdLabels": true,
        "showThresholdMarkers": true
      },
      "datasource": {
        "type": "prometheus",
        "uid": "prometheus"
      }
    },
    {
      "id": 3,
      "title": "Error Rate",
      "type": "stat",
      "gridPos": {
        "h": 8,
        "w": 6,
        "x": 18,
        "y": 0
      },
      "targets": [
        {
          "expr": "sum(rate(istio_requests_total{reporter=\"destination\",destination_service_namespace=\"$namespace\",destination_service_name=\"$service\", response_code=~\"5..\"}[5m])) / sum(rate(istio_requests_total{reporter=\"destination\",destination_service_namespace=\"$namespace\",destination_service_name=\"$service\"}[5m])) * 100",
          "refId": "A",
          "datasource": {
            "type": "prometheus",
            "uid": "prometheus"
          }
        }
      ],
      "fieldConfig": {
        "defaults": {
          "unit": "percent",
          "thresholds": {
            "mode": "absolute",
            "steps": [
              {
                "value": 0,
                "color": "green"
              },
              {
                "value": 1,
                "color": "yellow"
              },
              {
                "value": 5,
                "color": "red"
              }
            ]
          }
        }
      },
      "datasource": {
        "type": "prometheus",
        "uid": "prometheus"
      }
    },
    {
      "id": 4,
      "title": "Request by Source",
      "type": "table",
      "gridPos": {
        "h": 8,
        "w": 12,
        "x": 0,
        "y": 8
      },
      "targets": [
        {
          "expr": "sum(rate(istio_requests_total{reporter=\"destination\",destination_service_namespace=\"$namespace\",destination_service_name=\"$service\"}[5m])) by (source_workload, source_workload_namespace, response_code)",
          "format": "table",
          "instant": true,
          "refId": "A",
          "datasource": {
            "type": "prometheus",
            "uid": "prometheus"
          }
        }
      ],
      "transformations": [
        {
          "id": "organize",
          "options": {
            "excludeByName": {
              "Time": true
            },
            "indexByName": {
              "source_workload": 0,
              "response_code": 1,
              "Value": 2
            },
            "renameByName": {
              "source_workload": "Source",
              "response_code": "Code",
              "Value": "RPS"
            }
          }
        }
      ],
      "datasource": {
        "type": "prometheus",
        "uid": "prometheus"
      }
    },
    {
      "id": 5,
      "title": "Upstream Overflow and Retry Exhaustion",
      "type": "timeseries",
      "gridPos": {
        "h": 8,
        "w": 12,
        "x": 12,
        "y": 8
      },
      "targets": [
        {
          "expr": "sum(rate(istio_requests_total{reporter=\"source\",destination_service_namespace=\"$namespace\",destination_service_name=\"$service\", response_flags=~\".*UO.*\"}[5m]))",
          "legendFormat": "Upstream overflow",
          "refId": "A",
          "datasource": {
            "type": "prometheus",
            "uid": "prometheus"
          }
        },
        {
          "expr": "sum(rate(istio_requests_total{reporter=\"source\",destination_service_namespace=\"$namespace\",destination_service_name=\"$service\", response_flags=~\".*URX.*\"}[5m]))",
          "legendFormat": "Retry/connect attempts exhausted",
          "refId": "B",
          "datasource": {
            "type": "prometheus",
            "uid": "prometheus"
          }
        }
      ],
      "datasource": {
        "type": "prometheus",
        "uid": "prometheus"
      }
    }
  ],
  "templating": {
    "list": [
      {
        "name": "namespace",
        "type": "query",
        "query": "label_values(istio_requests_total, destination_service_namespace)",
        "datasource": {
          "type": "prometheus",
          "uid": "prometheus"
        },
        "current": {
          "selected": true,
          "text": "default",
          "value": "default"
        },
        "multi": false
      },
      {
        "name": "service",
        "type": "query",
        "query": "label_values(istio_requests_total{destination_service_namespace=\"$namespace\"}, destination_service_name)",
        "datasource": {
          "type": "prometheus",
          "uid": "prometheus"
        },
        "current": {},
        "multi": false
      }
    ]
  },
  "time": {
    "from": "now-1h",
    "to": "now"
  },
  "refresh": "30s",
  "uid": "custom-istio-service"
}
仪表板文件预置
将上方完整 JSON 对象保存为 custom-istio-service.json。不要在预置仪表板文件中放省略号或 HTTP API { "dashboard": ... } 包装层。
kubectl create configmap grafana-dashboard-custom-istio \
  --from-file=custom-istio-service.json -n observability \
--dry-run=client -o yaml | kubectl apply -f -apiVersion: v1
kind: ConfigMap
metadata:
name: grafana-istio-provider
namespace: observability
data:
istio.yaml: |
apiVersion: 1
providers:
- name: istio
orgId: 1
folder: Istio
type: file
disableDeletion: false
editable: false
options:
path: /var/lib/grafana/istio-dashboards将这些挂载合并到现有 Grafana Deployment/Helm values,保留镜像、凭证、存储、探针和其他容器。容器名必须匹配实际 Deployment。通过 subPath 挂载的提供程序文件变化时,需要受控 Pod 滚动更新。若使用已配置仪表板 Sidecar,应遵循其 chart 设置;仅 grafana_dashboard 标签不安装或配置加载器。
spec:
  template:
    spec:
      containers:
      - name: grafana
        volumeMounts:
        - name: istio-dashboards
          mountPath: /var/lib/grafana/istio-dashboards
          readOnly: true
        - name: istio-provider
          mountPath: /etc/grafana/provisioning/dashboards/istio.yaml
          subPath: istio.yaml
          readOnly: true
      volumes:
      - name: istio-dashboards
        configMap:
          name: grafana-dashboard-custom-istio
      - name: istio-provider
        configMap:
          name: grafana-istio-provider
仪表板集成
Kiali → Grafana 和追踪链接
这些是可合并到前述示例的可选 Kiali CR 片段。Kiali 服务器必须可访问 internal_url;用户浏览器必须可访问 external_url。Kiali 必须通过 Grafana API 身份验证并找到确切仪表板名称。使用 Kiali 支持的 Secret 引用配置凭证,适用时信任私有 CA;此片段不创建凭证或公共端点。
spec:
  external_services:
    grafana:
      enabled: true
      internal_url: http://grafana.observability.svc.cluster.local:3000
      external_url: https://grafana.example.com
      datasource_uid: prometheus
      dashboards:
      - name: Istio Service Dashboard
        variables:
          datasource: var-datasource
          service: var-service
      - name: Istio Workload Dashboard
        variables:
          datasource: var-datasource
          namespace: var-namespace
          workload: var-workload
追踪章节 Jaeger HTTP 查询端点的当前配置位于 external_services.tracing 下,端口 16686 使用 use_grpc: false。启用前验证后端/API 兼容性和身份验证;OAuth2 注入仅支持 HTTP 传输。Jaeger 和 Tempo 集成是可选且独立配置。Kiali 自定义仪表板有自己的模式;不能将 Grafana JSON 插入为 external_services.custom_dashboards 列表。
spec:
  external_services:
    tracing:
      enabled: true
      provider: jaeger
      internal_url: http://jaeger-query.observability.svc.cluster.local:16686
      external_url: https://jaeger.example.com
      use_grpc: false
Grafana → Jaeger 链接
将样例映射合并到现有 Prometheus 数据源。名称必须匹配实际样例标签(通常 trace_id),jaeger 必须是现有数据源 UID;此操作不生成样例。
# Prometheus datasource configuration
apiVersion: v1
kind: ConfigMap
metadata:
  name: grafana-datasources
data:
  prometheus.yaml: |
    apiVersion: 1
    datasources:
    - name: Prometheus
      type: prometheus
      jsonData:
        exemplarTraceIdDestinations:
        - datasourceUid: jaeger
          name: trace_id
Loki → Tempo 集成
将以下字段合并到现有 Loki 数据源。需要真实 trace_id 日志字段、启用追踪,并在 Tempo 保留相同追踪;request_id 不是 trace ID。
# Loki datasource configuration
apiVersion: 1
datasources:
- name: Loki
  type: loki
  jsonData:
    derivedFields:
    - datasourceUid: tempo
      matcherRegex: '"trace_id"\s*:\s*"([0-9a-fA-F]{32})"'
      name: TraceID
      url: '$${__value.raw}'
      urlDisplayLabel: 'View Trace'
最佳实践
1. 仪表板组织
Grafana Folder Structure:
├── Istio/
│   ├── Overview/
│   │   ├── Istio Mesh Dashboard
│   │   └── Istio Control Plane Dashboard
│   ├── Services/
│   │   ├── Istio Service Dashboard
│   │   └── Custom Service Dashboards
│   ├── Workloads/
│   │   └── Istio Workload Dashboard
│   ├── Gateways/
│   │   └── Istio Gateway Dashboard
│   └── Logs/
│       ├── Loki Istio Dashboard (#14876)
│       └── Access Log Analysis
2. 变量使用
所有仪表板使用一致变量:
{
  "templating": {
    "list": [
      {"name": "datasource", "type": "datasource"},
      {"name": "namespace", "type": "query"},
      {"name": "service", "type": "query"},
      {"name": "workload", "type": "query"},
      {"name": "interval", "type": "interval", "auto": true}
    ]
  }
}
3. 警报管理
- 分层警报:严重(PagerDuty)→ 警告(Slack)→ 信息(电子邮件)
- 警报分组:按服务、命名空间分组
- 静默规则:维护期间静默警报
4. 性能优化
# Grafana configuration
[dashboards]
min_refresh_interval = 10s

[panels]
disable_sanitize_html = false

[dataproxy]
timeout = 30查询优化:
- 使用记录规则预计算常用查询
- Prometheus rate 窗口使用
$__rate_interval;$__interval控制查询步长/分桶 - 每秒速率使用
rate(),区间总量使用increase();两者均处理计数器重置
5. 访问控制
这些设置禁用匿名访问/注册,并分配默认 Viewer 组织角色;不是完整逐资源 RBAC 策略。暴露前,通过 Kubernetes Secret 和 Grafana 文档规定的密钥机制配置现有部署管理员凭证。仅此 ConfigMap 不设置密码。
# Grafana authentication and default organization role
apiVersion: v1
kind: ConfigMap
metadata:
  name: grafana-config
data:
  grafana.ini: |
    [auth]
    disable_login_form = false

    [auth.anonymous]
    enabled = false

    [auth.basic]
    enabled = true

    [users]
    allow_sign_up = false
    auto_assign_org = true
    auto_assign_org_role = Viewer

    [security]
    admin_user = admin
6. 备份和恢复
备份预置仪表板/数据源文件,并用 Grafana 支持的 UI/API 导出 UI 管理仪表板。完整恢复还需要通过应用一致备份流程备份 Grafana 数据库、配置和插件。不存在 grafana-cli admin export-dashboard 命令。
Prometheus 快照使用管理 HTTP API,不是 promtool tsdb snapshot。必须有意在受保护维护端点启用 API。将选定 Prometheus Pod 转发到 localhost 后,维护示例如下:
curl -fsS -X POST http://localhost:9090/api/v1/admin/tsdb/snapshot响应提供服务器数据目录下的快照目录。将已完成快照复制到备份目的地;同一磁盘上的快照不是独立备份。分别验证还原、保留和远程写入恢复。本次文档审计未执行备份/部署操作。