Datadog
最后更新: October 12, 2026 Helm chart 3.244.0;对应的 Agent/Cluster Agent 为 7.83.1。 下文说明配置、SDK 和本地验证的限制;未修改任何 Datadog 租户。
简介
Datadog 提供 SaaS 可观测性后端。团队仍然负责采集器、身份、网络访问、埋点、数据披露、保留期、监控器和成本。 基础设施监控、APM、性能分析、日志及其他产品具有不同的授权和计费维度;安装 Agent 并不包含所有产品。
| 主题 | Datadog | CloudWatch | 自行管理的 Prometheus / Grafana |
|---|---|---|---|
| 后端 | Datadog SaaS,具有站点特定的可用性 | AWS 托管服务 | 自行运维的存储、查询和可视化 |
| 采集 | Agent/Cluster Agent、库和受支持的 OTel 路径 | AWS 服务指标、agents/SDKs/OTLP | Exporters、抓取、agents 和 remote write |
| APM/日志 | 选择并配置所需产品 | Application Signals、追踪和 Logs 集成 | 配置相关后端和采集器 |
| 运维 | 采集器/配置和应用程序职责仍由团队承担 | 采集/配置和响应职责仍由团队承担 | 后端和采集职责仍由团队承担 |
| 成本 | 主机和其他产品特定的使用量/保留期单位 | 指标/观测/OTLP/日志/查询/告警单位 | 基础设施和运维工作量 |
为组织及其凭证选择正确的 Datadog 站点; API 端点、数据驻留、可用产品和定价条款在不同站点之间不可互换。请使用集成目录, 而非固定的集成数量声明或通用的“简单/高级/便宜”排名。
EKS 集成架构
| 组件 | 职责 / 边界 |
|---|---|
| Node Agent | 主机/容器检查;通常是在受支持 EC2 节点上的 DaemonSet |
| Cluster Agent | 共享的 Kubernetes 元数据/检查、事件协调,以及可选的 admission/external-metric 功能 |
| Trace Agent | 接收应用程序追踪负载并将其转发 |
| Process collection / system-probe | 具有自身 OS、权限和产品要求的可选进程/网络/安全功能 |
| Admission Controller | 将连接设置以及在配置时受支持的客户端库注入新的 pods |
应用程序埋点会生成 traces/profiles;仅有 Agent 监听器或 pod 标签并不能证明已经完成埋点。Cluster Agent 并不是常规的应用程序日志或 trace 转发路径。
本章的安装目标是 基于 Linux EC2 的 EKS 节点。EKS Fargate 使用文档说明的每个 pod/sidecar 采集模型,而不是此主机 DaemonSet。 UDS 是主机本地资源,且不支持 Windows。Windows、Bottlerocket、 Auto Mode 和混合计算需要其发行版/功能特定的设置和受支持的主机访问方式。请勿禁用 TLS 验证, 也不要声称所有 eBPF/process 功能在所有位置都能运行。
Datadog 针对 Kubernetes 1.33+ 与 AllocatedResources 的兼容性说明 Agent 和 Cluster Agent 需为 7.67+, 并建议其版本保持匹配。此类最低功能要求并非当前的 EKS 支持矩阵。
该概览展示了可能的采集路径。Traces/profiles 需要应用程序埋点和已选择的产品;必须配置 Watchdog 通知路由。
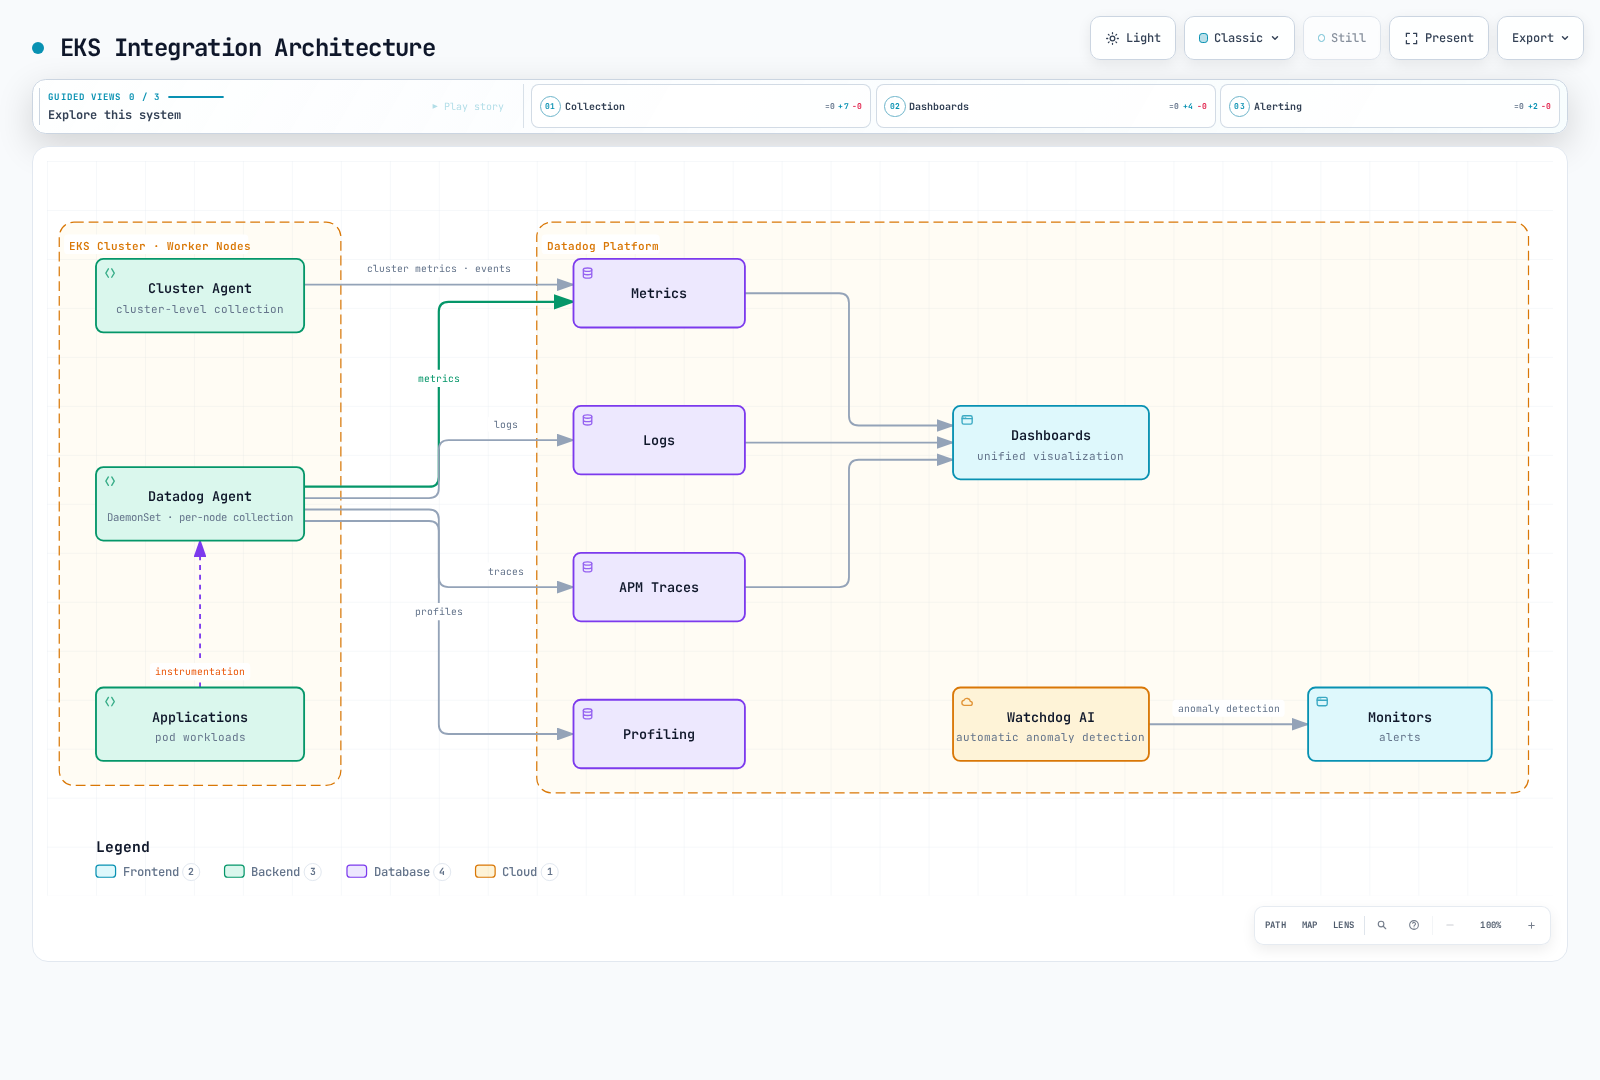
Datadog Agent 安装
Datadog 建议使用其 Operator 进行更高层次的生命周期配置,同时也支持 Helm 安装。此示例通过 Datadog Agent Helm chart 管理 node/Cluster Agents。Chart 3.244.0 捆绑了一个可选的 Operator 依赖项; datadog.operator.enabled: false 会将该额外 controller 排除在本示例之外。 这并不意味着 Operator 已过时。
该 chart 默认使用 Agent/Cluster Agent 7.82.3。此示例显式将二者固定为 7.83.1 和已验证的 image-index digests。该版本包含网络测试计费、containerd 快照清理和 Cluster Agent leader-lock 关闭修复。 Agent/Cluster Agent image indexes 包含 Linux amd64/arm64。成功的 template 渲染并非 Kubernetes 部署或运行时兼容性测试。
凭证和安装所有权
此配置文件使用原生 aws.secrets 后端从 AWS Secrets Manager 获取 Datadog API key 和共享的 Cluster Agent token。基线数据摄取不需要 application key; external metrics 仍处于禁用状态。
在 ap-northeast-2 中准备带有 JSON 字符串键 api-key 和 cluster-token 的 observability/datadog;token 必须为加密安全的随机值,且至少 32 个字符。API key 必须与 Datadog 站点匹配。两个 ServiceAccounts, 命名空间 datadog 中的 datadog 和 datadog-cluster-agent,均需要范围限定的 IRSA roles、区域性 STS/Secrets Manager 连接,以及在适用时的 KMS 权限。请替换两个示例 role ARNs。EC2 metadata 凭证回退已禁用。 参阅完整前提条件和可复用配置文件。
使用 Python 3/PyYAML 6.0.3 以及该仓库目录中的可执行固定 chart postrenderer。 它会将恰好七个硬编码的 SecretKeyRef 条目替换为字面量 ENC[...] handles, 同时保留 node、trace、init 和 Cluster Agent consumers。原生解析会更新内存中的配置, 而非环境。init script 需要非空的 DD_API_KEY,因此在没有有效替代项的情况下删除它会导致启动失败。 must-use-secret-postrenderer Secret 有意不存在;请勿创建它来绕过缺失的 renderer。每次 install/upgrade 都要保留 renderer, 并审查对固定 chart、images 或配置文件契约的变更。
这些命令仅在安装时变更集群;审计中未执行部署。请在准备 IAM/secret 前提条件后, 从仓库根目录、现有的 datadog namespace 中,使用自己拥有的 release 运行。
PROFILE=examples/observability/secret-profiles
helm repo add datadog https://helm.datadoghq.com
helm repo update datadog
helm template datadog datadog/datadog --version 3.244.0 \
  --namespace datadog --include-crds -f "$PROFILE/datadog-values.yaml" \
  --post-renderer "$PROFILE/datadog_postrender.py" > datadog-reviewed-render.yaml
# Review resources and ownership first; retain the renderer on EVERY upgrade.
helm upgrade --install datadog datadog/datadog --version 3.244.0 \
  --namespace datadog -f "$PROFILE/datadog-values.yaml" \
  --post-renderer "$PROFILE/datadog_postrender.py"
已审查的 values
以下内容与可复用的 datadog-values.yaml 匹配。日志由容器配置选择启用, APM/DogStatsD 使用 UDS,且不会在此处启用全局自动库注入、external HPA metrics、 discovery network statistics 和可选的 process/network collection。 应用程序 namespace 应与 Agent namespace 分离;SSI 不会对 Agent 自身 namespace 中的 pods 进行埋点。
# datadog 3.244.0: postrenderer required; replace example IRSA role ARNs.
targetSystem: linux
registry: gcr.io/datadoghq
datadog:
  apiKeyExistingSecret: must-use-secret-postrenderer
  clusterName: my-eks-cluster
  site: datadoghq.com
  tags:
  - env:demo
  - team:platform
  logs:
    enabled: true
    containerCollectAll: false
    containerCollectUsingFiles: true
  apm:
    socketEnabled: true
    portEnabled: false
    instrumentation:
      enabled: false
  dogstatsd:
    useSocketVolume: true
    useHostPort: false
    nonLocalTraffic: false
  processAgent:
    processCollection: false
    processDiscovery: false
    containerCollection: true
  networkMonitoring:
    enabled: false
  discovery:
    enabled: false
    networkStats:
      enabled: false
  autoscaling:
    workload:
      enabled: false
  profiling:
    enabled: null
  collectEvents: true
  prometheusScrape:
    enabled: false
  kubeStateMetricsCore:
    enabled: true
    collectSecretMetrics: false
    collectConfigMaps: false
  operator:
    enabled: false
  secretBackend:
    type: aws.secrets
    config:
      aws_session:
        aws_region: ap-northeast-2
    enableGlobalPermissions: false
  env: &id001
  - name: AWS_EC2_METADATA_DISABLED
    value: 'true'
  - name: DD_SECRET_REFRESH_INTERVAL
    value: '0'
  - name: DD_SECRET_REFRESH_ON_API_KEY_FAILURE_INTERVAL
    value: '0'
clusterAgent:
  enabled: true
  replicas: 2
  image:
    tag: 7.83.1
    digest: sha256:8e420c81e68abec34ab792c72a6513b739dcba8f7682c52e1e7e276363827b1a
  metricsProvider:
    enabled: false
    useDatadogMetrics: false
  admissionController:
    enabled: true
    mutateUnlabelled: false
  tokenExistingSecret: must-use-secret-postrenderer
  rbac:
    create: true
    serviceAccountAnnotations:
      eks.amazonaws.com/role-arn: arn:aws:iam::111122223333:role/datadog-cluster-agent-secrets
  env: *id001
agents:
  image:
    tag: 7.83.1
    digest: sha256:ed0bd588e955d82f661d1b8dd1cdf179c1023e74a2817e7a812c99d52f05c319
  rbac:
    create: true
    serviceAccountAnnotations:
      eks.amazonaws.com/role-arn: arn:aws:iam::111122223333:role/datadog-agent-secrets
postrendering 后唯一与凭证有关的环境值为 ENC[observability/datadog;api-key] 和 ENC[observability/datadog;cluster-token]。 DD_SECRET_BACKEND_TYPE/CONFIG 仅携带后端类型和区域。没有 shell 会导出已解析的值,Helm values 中未放入真实 key, 配置文件也不需要 Kubernetes credential Secret。两个 init-volume containers 仅复制 image 配置;init-config 使用 API-key handle 进行 bootstrap 检查。实际的原生后端授权和 Datadog 数据摄取仍需运行时验证。
已明确禁用计划和 API-failure secret refresh。请通过经过批准的、协调的 node/trace 和 Cluster Agent Pods 重启来轮换; 在整个 fleet 使用新 key 前,请保持旧 API key 有效。cluster-token 变更可能在混合版本 rollout 期间中断 node/Cluster Agent authentication,因此请计划维护窗口或单独验证的迁移。这里不声称支持零停机轮换。 参阅 Datadog secret backends。
processAgent.enabled 已弃用;请使用各个 collection options。 chart 在适用时已挂载 /etc/passwd,因此不要添加重复的手动 passwd volumes/mounts。资源覆盖按组件配置,例如 agents.containers.agent.resources;应在负载下为实际渲染的 containers 确定大小。 两个 Cluster Agent replicas 不能替代放置、干扰和故障测试。
原始顶级 kubeStateMetricsEnabled 和 prometheus.enabled 条目 并不配置所声称的集成。旧版 KSM 选项嵌套在 datadog 下;该示例使用 datadog.kubeStateMetricsCore.enabled 并避免重复的旧版采集。显式 Datadog Autodiscovery checks 独立于启用 annotation-wide prometheusScrape。
datadog.profiling.enabled 有效。它会向符合条件的 pods 注入 DD_PROFILING_ENABLED,并需要安装的 client libraries 和 Cluster Agent 7.57+。 它不会在任意未埋点的应用程序中安装 profiler。请有意识地选择其 null/false/auto/true 行为。 同样,启用 external HPA metrics 需要其 application key、API permissions、service/CRDs 和实际 metric availability;network monitoring 需要受支持的 system-probe access。
AWS 账户集成是单独的路径
SaaS AWS account integration 使用经授权的 cross-account role 和 Datadog 提供的 external ID, 并具有所选 integrations 所需的 permissions。附加到 node Agent SA 的任意 IRSA role 并不会配置该 SaaS integration。常规 Kubernetes Agent collection 不需要此前在此展示的宽泛 CloudWatch/EC2/tag policy。
仅对实际调用 AWS 的 Agent/check 使用 Pod Identity 或 IRSA,且应使用其 特定的 role、trust 和 permissions。解析已渲染的 service-account 名称;为猜测的 datadog-agent SA 创建 IAM association 并不会绑定 Helm release 使用的 另一个 SA。绝不要将本地 STS caller check 视为 workload identity 的证明。
基础设施监控
检查指标的采集器、单位和 tags
| 指标 / 来源 | 含义 |
|---|---|
system.cpu.idle / System check | CPU 空闲百分比;适用于基于百分比的节点阈值 |
system.mem.total, system.mem.used, system.mem.free | 内存测量值;free 不等同于可用/可回收内存 |
kubernetes.cpu.usage.total / Kubelet | Nanocores,不是百分比;一个 core 为 1,000,000,000 nanocores |
kubernetes.memory.usage, kubernetes.memory.limits | Bytes;比较 usage 和 limit 需要匹配相同的 entity/tag set |
kubernetes.pods.running, kubernetes.containers.restarts | 有效的 Kubelet gauges:运行中的 pods 和累积的 container restarts |
kubernetes_state.deployment.replicas_available, kubernetes_state.deployment.replicas_desired | Kubernetes State Metrics Core Deployment 状态 |
kubernetes_state.pod.status_phase, kubernetes_state.service.count | Pod phase/service inventory;检查其文档说明的 grouping tags |
kubernetes_state.container.restarts | State Core 的 restart gauge,具有 namespace/pod/container tags |
旧版 Kubernetes integration、Kubelet check 和 State Core 具有不同的 catalogues。一个 catalogue 中不存在的 metric 不一定已从 Agent 中移除。请勿盲目重命名有效的 Kubelet metrics。 filesystem/network availability 和 rate units 取决于采集器/运行时;请阅读该 metric 的实际定义。
对此 Kubernetes 安装使用标准 kube_cluster_name tag,并在分组前检查 真实 metric tags。以 cluster 为中心的 State Core metrics 不一定携带 host tag。cluster_name 和 kube_cluster_name 不可互换。 将原始 nanocore 值与 80 比较并不表示 80% CPU。
OpenMetrics Autodiscovery
将以下元数据片段合并到一个 container 名为 app 且在 port 9464 上提供 gauge queue_depth 的 workload 中。它不会创建该应用程序或 endpoint。annotation 的 container identifier 必须匹配。 如有需要,请保护 endpoint 并配置 TLS/authentication。
metadata:
  annotations:
    ad.datadoghq.com/app.checks: "{\n  \"openmetrics\": {\n    \"init_config\": {},\n\
      \    \"instances\": [\n      {\n        \"openmetrics_endpoint\": \"http://%%host%%:9464/metrics\"\
      ,\n        \"namespace\": \"my_app\",\n        \"metrics\": [\n          {\n\
      \            \"queue_depth\": \"queue_depth\"\n          }\n        ]\n    \
      \  }\n    ]\n  }\n}"
当前 openmetrics check 使用 openmetrics_endpoint。这些 Datadog Autodiscovery annotations 不需要单独的 Prometheus server 或 chart 的广泛 prometheusScrape discovery。限制所选 metrics/labels。 对于 counters 和 histograms,请验证 name normalization、发出的 .count/bucket series 以及 check-version behavior, 而不要假定 Prometheus name 同时也是最终的 Datadog name。
DogStatsD:使用应用程序可访问的 endpoint
应用程序 pod 的 localhost 并不是 node Agent。Linux 示例使用 host-local UDS directory。 Admission Controller 的 socket mode 可以注入 DD_DOGSTATSD_URL、DD_TRACE_AGENT_URL 和 volume;否则请显式配置匹配的 mounts 和 permissions。Pod 特定的 admission.datadoghq.com/config.mode 是标签,不是 annotation。请挂载父目录,以便 Agent restart 后 socket replacement 仍然可见。
Python helper 已使用 datadog==0.53.0 检查。向 socket_path 传递实际 filesystem path,例如 /var/run/datadog/dsd.socket;其他 SDKs/environment settings 使用的 unix:// URL 不是相同的 argument format。使用实际 interval counts(包括零 good/error values)调用 emit_batch。
from datadog import DogStatsd


def emit_batch(client, total, errors):
    """Report one real interval; send zeros instead of omitting counters."""
    if any(isinstance(x, bool) or not isinstance(x, int) for x in (total, errors)):
        raise ValueError("counts must be integers")
    if not 0 <= errors <= total:
        raise ValueError("require 0 <= errors <= total")
    client.increment("requests.total", total)
    client.increment("requests.error", errors)
    client.increment("requests.good", total - errors)


# Create once in an application with the Agent's UDS directory mounted.
# This construction does not mean that the socket or receiving Agent is ready.
def make_metrics_client(socket_path):
    return DogStatsd(
        socket_path=socket_path,
        namespace="my_app",
        constant_tags=["env:demo", "service:orders"],
        disable_telemetry=True,
        disable_buffering=True,
    )
Go helper 使用 datadog-go/v5。使用 WithNamespace("my_app.") 和相同的 env:demo,service:orders tags 创建 client。检查 constructor、send 和 close errors;不要丢弃 statsd.New error。该 helper 不会关闭调用方提供的共享 client。
package metrics

import (
    "fmt"

    "github.com/DataDog/datadog-go/v5/statsd"
)

// The caller creates/reuses the client, checks New's error, and closes it at shutdown.
// For the Linux UDS example, use unix:///var/run/datadog/dsd.socket.
func EmitBatch(client *statsd.Client, total, errors int64) error {
    if errors < 0 || total < errors {
        return fmt.Errorf("require 0 <= errors <= total")
    }
    for _, item := range []struct {
        name string
        value int64
    }{
        {"requests.total", total},
        {"requests.error", errors},
        {"requests.good", total - errors},
    } {
        if err := client.Count(item.name, item.value, nil, 1); err != nil {
            return err
        }
    }
    return nil
}| DogStatsD 类型 | 解释 |
|---|---|
| Counter | 区间计数;Datadog 可能将其存储为 rate。.as_count() 会为查询窗口重建计数 |
| Gauge | queue depth 等快照;对快照求和并不是已处理请求数 |
| Histogram | 由接收 Agent 聚合;对每个 host percentile 求平均不会产生全局 percentile |
| Distribution | 支持后端 distribution aggregation;审查已启用的 percentiles、tags 和计费 |
| Service check | 来自真实 health check 的状态:0 OK、1 warning、2 critical、3 unknown |
本地 datagram delivery 不会确认 SaaS ingestion。UDP 可能丢失 packets; UDS/client buffering 和 Agent queues 也需要监控。示例 helper 不启用 DogStatsD client telemetry, 因此请为部署选择单独的 collection-health signal。Counter retries/duplicate sends 并不是 exactly-once business ledger。
基于文件的 Autodiscovery 配置
对于 Helm 管理的配置,datadog.confd 会创建并挂载 check files。 仅因一个独立 ConfigMap 名为 datadog-checks,它并不会被自动发现。 以下 NGINX fragment 需要匹配的 image identity 和已配置、已授权的 stub_status endpoint。
datadog:
  confd:
    nginx.yaml: "ad_identifiers:\n  - nginx\ninit_config: {}\ninstances:\n  - nginx_status_url:\
      \ http://%%host%%:80/nginx_status\n"
经过 authentication 的 Redis check 还需要正确的 port/TLS 和 credential delivery。%%env_REDIS_PASSWORD%% 读取的是 Agent 的 environment,而非 Redis application pod 的 environment。优先使用已配置的 Datadog secret backend 或具备所需特定 permissions 的受保护 file delivery;不要在公开 check examples 中暴露 passwords,也不要仅为 discovery 授予 cluster-wide Secret reads。
APM 和分布式追踪
本地 SDK 注入和 SSI 是明确的选择
admission opt-in label 允许 mutation/connection-setting injection。要安装 tracing library,请配置 SSI targets 或受支持的 language/version annotation。 仅有 label 并不能证明 SDK 已安装或 traces 已到达 Datadog。Java/Python/Node.js 本地注入需要 Cluster Agent 7.40+;.NET/Ruby 需要 7.44+。Cluster Agent 7.83.1(本指南中固定的版本)也会从注入中排除 kube-system 和自身 namespace。
对于受控 Java 示例,将以下 pod-template fragment 合并到 application namespace 中的现有 Deployment,同时保留其 selector、containers 和 security settings。它并非可以单独应用的完整 Deployment。 Java init image gcr.io/datadoghq/dd-lib-java-init:v1.66.0 已针对 Linux amd64/arm64 验证。请验证实际应用程序的 JVM/framework/image compatibility。
spec:
  template:
    metadata:
      labels:
        admission.datadoghq.com/enabled: 'true'
        admission.datadoghq.com/config.mode: socket
        tags.datadoghq.com/env: demo
        tags.datadoghq.com/service: orders
        tags.datadoghq.com/version: 1.0.0
      annotations:
        admission.datadoghq.com/java-lib.version: v1.66.0
tags.datadoghq.com/* labels 提供统一的 service/environment/version tagging。 不要仅将 label 放在 Deployment metadata 上并期望其 pods 继承。注入发生在新的 pods 被 admission 时。 确认注入的 init containers、library files、UDS mounts/permissions 和非 secret connectivity settings,然后验证实际 traffic/traces。namespace exclusions、webhook failures、 security policies 和 unsupported images 都可能阻止 instrumentation。
cluster-wide SSI 是通过 datadog.apm.instrumentation 配置的替代方案,具有已审查的 namespace/pod targets 和 library versions。 避免无意中组合 manual 和 injected tracers:注入的 library 可能优先于手动安装的 library。Profiler enablement 仍需要 受支持的 client library 及其自身的 product/runtime conditions。
手动 Java instrumentation
在启动 application JVM 时使用分阶段、版本化的 dd-java-agent.jar,或使用上面已验证的 injection route。仅添加 dd-trace-api 可访问 annotation/API;它不会启动运行时 bytecode instrumentation。 以下 Maven dependency 和 Java source 是单独的文件。
<dependency>
  <groupId>com.datadoghq</groupId>
  <artifactId>dd-trace-api</artifactId>
  <version>1.66.0</version>
</dependency>import java.util.function.Supplier;
import datadog.trace.api.Trace;
public final class TraceMethods {
private TraceMethods() {}
@Trace(operationName = "order.process", resourceName = "process_order")
public static <T> T process(Supplier<T> handler) {
return handler.get();
}
}handler 表示调用方提供的 application code。请使用有界的 operation/resource names。旧示例中每个 order/customer identifier 标签对此演示并非必需,且可能造成数据披露/cardinality risks。Manual span APIs 需要其对应的受支持 bridge/library; 不要向仅有 annotation API 的项目添加 OpenTracing imports。
手动 Python instrumentation
对此经检查的 4.14.0 示例,请使用当前 ddtrace.trace import。将 dependency declaration 保留在 requirements.txt 中,不要置于 Python code block 内。 对于 framework auto-instrumentation,请在 application imports 之前遵循所选 ddtrace-run/SSI 设置;不要假定此 helper 会 patch 整个 framework。
ddtrace==4.14.0from ddtrace.trace import tracer
def process_order(handler):
with tracer.trace("order.process", service="orders", resource="process_order") as span:
span.set_tag("operation.kind", "order")
return handler()等效的 tracer.wrap decorator 可用于 method tracing。handler 引发的 exceptions 必须传播;记录 span 并不是 application retry 或 success guarantee。 在受支持的 HTTP/message integrations 中使用正确的 service/env/version tags 和 context propagation。Service maps 来自观察到的 instrumented relationships,而非仅来自任意 DD_TAGS。
默认不要标记原始 customer/order identifiers、tokens 或 request bodies。 审查实际应用程序的 instrumentation capture、error messages 和 sampling/redaction rules。Auto-instrumentation 并不保证完全移除 PII。
日志管理
有意识地选择采集和解析
安装启用了 log collection,但保持 containerCollectAll: false。将此 metadata 合并到 container 名为 app 的 pod template 中。 multiline rule 适用于以日期开头的纯文本 Java records。 它不是通用 JSON-log parser。Container runtime framing 和 application message parsing 是独立阶段;请验证实际采集的 records。
metadata:
  annotations:
    ad.datadoghq.com/app.logs: "[\n  {\n    \"source\": \"java\",\n    \"service\"\
      : \"orders\",\n    \"log_processing_rules\": [\n      {\n        \"type\": \"\
      multi_line\",\n        \"name\": \"java_timestamp_start\",\n        \"pattern\"\
      : \"^\\\\d{4}-\\\\d{2}-\\\\d{2}\"\n      }\n    ]\n  }\n]"
对于每行一个 JSON event 的 applications,请使用受支持的 JSON path,而不是使用此 rule 连接无关的 JSON events。File access、runtime paths、annotation matching、exclusion settings 和 backend pipeline filters 都会影响 collection。使用一个匹配的 application 和一个排除的 application 检查 selective collection。
Pipeline 请求结构
此请求使用实际 API fields match_rules 和 support_rules。 旧 camelCase fields 并非 Logs API model。sample message 定义预期的 line format;请使用应用程序的实际 format/timezone,并测试 unmatched/multiline/error cases。有效的 request model 并不证明 Datadog tenant 中的 Grok parsing 或 ingestion/indexing。
{
  "name": "Java application logs",
  "is_enabled": true,
  "filter": {
    "query": "source:java service:orders"
  },
  "processors": [
    {
      "type": "grok-parser",
      "name": "Parse the documented Java line format",
      "is_enabled": true,
      "source": "message",
      "samples": [
        "2026-09-13 12:00:00,123 INFO [main] example.Service - completed"
      ],
      "grok": {
        "support_rules": "",
        "match_rules": "java_log %{date(\"yyyy-MM-dd HH:mm:ss,SSS\"):timestamp} %{word:level} \\[%{notSpace:thread}\\] %{notSpace:logger} - %{data:message}"
      }
    },
    {
      "type": "status-remapper",
      "name": "Use level as status",
      "is_enabled": true,
      "sources": [
        "level"
      ]
    },
    {
      "type": "date-remapper",
      "name": "Use parsed timestamp",
      "is_enabled": true,
      "sources": [
        "timestamp"
      ]
    }
  ]
}
创建/重新排序 Pipeline 会改变匹配日志的处理。请在正确的 site、范围限定的 API permissions 和现有 pipeline ownership 下配置它。 此审计期间未发送任何 pipeline request。
Trace-log correlation 和 MDC 所有权
尽可能使用受支持的 automatic log injection,并在 structured logs 中将 trace/span IDs 保留为 strings。还需要正确的 service/env/version、timestamps、parsing 和 可用 trace data;仅有两个 ID fields 并不保证 correlation。当 process 未埋点时,不存在有用的 active trace ID。
对于明确管理 SLF4J MDC 的 applications,此 helper 会在成功和失败时恢复调用方的 完整先前 context。旧的无条件 MDC.clear() 会丢失无关的调用方 fields。它是 synchronous helper, 不是 async context propagation mechanism 或完整的 servlet filter。
import java.util.Map;
import java.util.function.Supplier;
import datadog.trace.api.CorrelationIdentifier;
import org.slf4j.MDC;

public final class TraceLogContext {
    private TraceLogContext() {}

    public static <T> T withTraceContext(Supplier<T> handler) {
        Map<String, String> previous = MDC.getCopyOfContextMap();
        try {
            MDC.put("dd.trace_id", CorrelationIdentifier.getTraceId());
            MDC.put("dd.span_id", CorrelationIdentifier.getSpanId());
            return handler.get();
        } finally {
            if (previous == null) {
                MDC.clear();
            } else {
                MDC.setContextMap(previous);
            }
        }
    }
}
它需要 dd-trace-api 和应用程序兼容的 SLF4J API/provider。 logging pattern 或 JSON encoder 必须包含 MDC values。不要在没有 servlet API、imports 和 checked-exception contract 的情况下复制 servlet example。
仪表板和告警
仪表板请求构建
此 helper 使用 datadog-api-client==2.60.0 构建 request body。cluster 和 namespace template variables 确实由其 queries 引用。host widget 使用 percent metric;pod widget 使用 memory bytes 及其 namespace filter。检查所选 data 是否确实具有 grouping tags。
from datadog_api_client.v1.model.dashboard import Dashboard
from datadog_api_client.v1.model.dashboard_layout_type import DashboardLayoutType


def build_dashboard(cluster_name):
    return Dashboard(
        title="EKS observability example",
        layout_type=DashboardLayoutType.ORDERED,
        widgets=[
            {"definition": {
                "type": "timeseries",
                "title": "CPU idle by host (%)",
                "requests": [{"q": "avg:system.cpu.idle{$cluster} by {host}", "display_type": "line"}],
            }},
            {"definition": {
                "type": "toplist",
                "title": "Top 10 pod memory series by mean (bytes)",
                "requests": [{"q": "top(sum:kubernetes.memory.usage{$cluster,$namespace} by {pod_name,kube_namespace}, 10, 'mean', 'desc')"}],
            }},
        ],
        template_variables=[
            {"name": "cluster", "prefix": "kube_cluster_name", "default": cluster_name},
            {"name": "namespace", "prefix": "kube_namespace", "default": "*"},
        ],
    )
调用方提供正确配置的 ApiClient 并使用 DashboardsApi 创建或更新目标 dashboard。记录/协调其返回的 ID; 按 title 重复创建可能产生 duplicates。site 和范围限定的 automation credentials 独立于 node Agent API key。 本次审计未调用 dashboard API。
Monitor queries 和单位
使用已配置的 Datadog Terraform provider 以及项目 version constraints/lock file。 这些是 resource fragments,并非完整的 provider/credential setup。thresholds 仅为示例;请检查真实 metric units、tags、windows 和 application objectives。 第一个 monitor 直接评估 idle percent,而非将 nanocores 与 80 比较并把结果称为“CPU percent”。
# Fragments for a configured, version-pinned Datadog Terraform provider.
# Replace notification destinations with approved, tested destinations.
resource "datadog_monitor" "low_cpu_idle" {
  name    = "Low CPU idle on EKS nodes"
  type    = "metric alert"
  message = "CPU idle on {{host.name}} is {{value}}%. Inspect the host and collection health."
  query   = "avg(last_5m):avg:system.cpu.idle{kube_cluster_name:my-eks-cluster} by {host} < 20"
  monitor_thresholds {
    warning  = 30
    critical = 20
  }
  require_full_window = false
  notify_no_data      = false
  tags               = ["env:demo", "team:platform"]
}

resource "datadog_monitor" "restart_total" {
  name    = "Container restart total exceeds example threshold"
  type    = "metric alert"
  message = "Inspect {{pod_name.name}} / {{kube_container_name.name}}. This is a restart total, not a count of new restarts in five minutes."
  query   = "max(last_5m):max:kubernetes_state.container.restarts{kube_cluster_name:my-eks-cluster} by {pod_name,kube_namespace,kube_container_name} > 3"
  monitor_thresholds {
    warning  = 2
    critical = 3
  }
  require_full_window = false
  notify_no_data      = false
  tags               = ["env:demo", "team:platform"]
}

resource "datadog_monitor" "request_error_rate" {
  name    = "High request error ratio"
  type    = "metric alert"
  message = "Error ratio for {{service.name}} is {{value}}%. Check traffic volume and the reporting path."
  query   = "sum(last_5m):sum:my_app.requests.error{env:demo} by {service}.as_count() / sum:my_app.requests.total{env:demo} by {service}.as_count() * 100 > 5"
  monitor_thresholds {
    warning  = 2
    critical = 5
  }
  require_full_window = false
  notify_no_data      = false
  tags               = ["env:demo", "type:application"]
}
restart gauge 是总数。在两个 windows 中比较重复 gauge samples 的 sums 并不能可靠地计算新 restarts, 尤其是在 resets、replacement pods 或不等 sampling 的情况下。recent-restart monitor 需要经过验证的 delta/reset design。本示例明确对 total 发出 alert。
error monitor 使用 emit_batch 发出的三个 counters, 包括 errors/good requests 的显式零值。对于 .as_count() evaluation,time aggregation 在除法之前发生:sum(errors)/sum(total),而非每个 time bucket ratio 的 sum。此路径应使用 sum aggregator。
零 traffic、缺失 telemetry 和确实无 errors 的 traffic 是不同的情况。 定义 minimum traffic/collection-health conditions,并验证 monitor 的 no-data behavior。notify_no_data: false 不会建立 health; 它只是在这些 fragments 中不会针对 missing data 发出通知。
对于内置 APM metrics,请使用所选 integration 生成的实际 trace.<operation>.hits/errors names 和 tags。Java、Python 和其他 integrations 并非都会发出 trace.http.request.*。Trace analytics、generated trace metrics 和 custom DogStatsD metrics 是不同来源。
Watchdog 和通知投递
Watchdog 可以呈现检测到的 anomalies/insights,而无需手动选择每个 threshold。insight 并不证明通知已送达。请使用 受支持的 Watchdog/monitor workflow,并在目标 site 中验证 event source、product availability 和 notification routing。
以下 event-monitor fragment 假定该 organization 中存在匹配 source:watchdog 的实际 events。它不会虚构 story_category group tag,也不保证每个 Watchdog result 都会出现在此 stream 中。在启用 notifications 前,请针对真实 events 验证 filter。
resource "datadog_monitor" "watchdog_events" {
  name    = "Review matching Watchdog events"
  type    = "event-v2 alert"
  message = "Review the matching Watchdog event and affected services. Add an approved notification destination."
  query   = "events(\"source:watchdog\").rollup(\"count\").last(\"5m\") > 0"
  tags    = ["env:demo", "type:watchdog"]
}
SLO 请求构建
基于 metric 的 SLO 需要定义明确的 good/total counts。以下 helper 使用上述显式 counters。 “Good”必须与应用程序的 SLI policy 一致;仅统计 HTTP 2xx 并非通用的 availability definition。请验证 zero-traffic 和 missing-data behavior,而不要将缺失视为 100% success。
from datadog_api_client.v1.model.service_level_objective_request import ServiceLevelObjectiveRequest


def build_success_slo():
    return ServiceLevelObjectiveRequest(
        name="Orders successful-request SLO",
        type="metric",
        description="Successful requests divided by all reported requests",
        query={
            "numerator": "sum:my_app.requests.good{env:demo,service:orders}.as_count()",
            "denominator": "sum:my_app.requests.total{env:demo,service:orders}.as_count()",
        },
        thresholds=[{"timeframe": "30d", "target": 99.9, "warning": 99.95}],
        tags=["env:demo", "service:orders"],
    )
这会构建 request,而非 live SLO。经配置的调用方可在验证 ownership、data 和 permissions 后将其传递给 ServiceLevelObjectivesApi.create_slo。Datadog 还支持 monitor-based 和 time-slice SLOs;应选择 匹配 SLI 的 model,而非强行将 gauge/restart total 纳入 good-event count。
成本结构
使用实际的产品和合同单位
| 组件 | 估算输入 |
|---|---|
| 基础设施 | 可计费的 hosts/containers 或适用的平台模型、plan 和 commitment terms |
| APM | 可计费 APM hosts 和所选 plan/model、包含的 allotments、摄取和索引的 spans |
| 日志 | 摄取量加上 indexing/retention/search/archive 选择 |
| Custom metrics / distributions | 不同的 metric/tag combinations、已启用的 aggregations 和适用的 included volumes |
| Additional products | Profiling、network/security、serverless 和其他已启用的产品费用 |
不要将每种产品合并为通用的 Free/Pro/Enterprise 表格。定价 页面区分产品、annual/on-demand terms 以及 attached 与 standalone offerings。基础设施 metrics、searchable traces 和 indexed logs 的 retention 并非一个共同的“15-month”设置。
对于旧的 100-node 示例,50 services 并不意味着 50 APM hosts。在 host-priced agreement 下, 首先确定实际可计费的 Infrastructure 和 APM host counts。对于 30 天内 100 GB/day,log ingestion 为 3,000 GB, 但仅摄取并非总 log bill。
Estimated cost =
  billable infrastructure units × applicable rate
  + billable APM units × applicable rate
  + ingested/indexed span overages under the contract
  + 3,000 GB × applicable log-ingestion rate
  + indexed events/retention/search/archive charges
  + custom-metric and other enabled-product charges
先前约 $3,350 的总计使用了不匹配的 APM units,且遗漏了可计费 dimensions。 它不是已测量的 production bill。请使用当前 site/product quote 和实测 usage,而非将该估算视为 budget guarantee。
Metrics、logs 和 trace controls 的作用各不相同
dogstatsd.nonLocalTraffic控制 receiver reachability;它不是 custom-metric quota。关闭 receiver 可能只会丢失 telemetry。ignoreAutoConfig禁用所选 automatic checks。Container exclusion filters 选择 containers;两者均不是通用的 tag-cardinality limiter。在其 collection owner 处审查允许的 metrics 和 tag values。更改 origin tag cardinality 可能改变可用 grouping tags,因此请重新检查 monitors/SLOs。
Source-side log exclusion 可避免发送所选 records。Index exclusion 发生在 更晚阶段,且不会消除 ingestion costs。保留 incident evidence 和 failures; 不要无论结果如何都丢弃每条 health-check line。
Sampling 与 indexing/retention 是独立的。
DD_TRACE_SAMPLE_RATE或 sampling rules 取决于 library/version 和 matching scope。文档中的 PythonDD_TRACE_RATE_LIMIT按 process 生效,并适用于配置的 sampling rules/rate, 而非 cluster-wide 或 dollar cap。10% trace rate 并不意味着整个 Datadog bill 降低 90%。
最佳实践
使用一致的 service/env/version labels 和有界 tags,并将 API-key ingestion 与 application-key automation permissions 分离。在收集所有 logs、process arguments 或 profiles 前, 审查 application capture 和 secret/redaction paths。监控 collector queues/drops,并在变更 filters 后验证真实 outputs。
与运维团队商定 alert severity、ownership 和 response targets。runbook 中的 P1/P2 labels 是运维 policy,并非独立的 Datadog resource definitions。测试实际 destinations、missing data 和 recovery notifications。 使用有文档说明的 SLI/SLO 和 traffic context,而不要只因样例中出现便选择 thresholds。
故障排除
从 installation owner、实际 pod/container names 和目标 site 开始。 检查字面量 native-backend handles、Secrets Manager IRSA 和所需 postrenderer、 Agent/Cluster Agent health、Kubelet/RBAC access、 scrape configuration 以及 queued/dropped telemetry。此 release 渲染的 node Agent pod 具有 agent 和 trace-agent containers;旧的 app=datadog selector 无法可靠替代检查当前 labels。
kubectl get pods -n datadog \
  -l app.kubernetes.io/instance=datadog,app.kubernetes.io/component=agent -o wide

# Select the actual node Agent pod after inspecting the list.
: "${DD_AGENT_POD:?Set the node Agent pod name}"
kubectl exec -n datadog "$DD_AGENT_POD" -c agent -- agent status
kubectl logs -n datadog "$DD_AGENT_POD" -c agent --tail=100
kubectl logs -n datadog "$DD_AGENT_POD" -c trace-agent --tail=100

# Check new application pods without dumping credentials/environment values.
: "${APP_NAMESPACE:?Set the application namespace}"
: "${APP_POD:?Set the application pod name}"
kubectl get pod -n "$APP_NAMESPACE" "$APP_POD" \
  -o jsonpath='{.spec.initContainers[*].image}'
kubectl get pod -n "$APP_NAMESPACE" "$APP_POD" \
  -o jsonpath='{range .spec.containers[*]}{.name}{": "}{.env[*].name}{"\n"}{end}'

# Create a local diagnostic archive only; review it before any authorized sharing.
kubectl exec -n datadog "$DD_AGENT_POD" -c agent -- agent flare --local
对于 traces,请验证真实 library injection/startup、socket 或 host endpoint、 permissions 和一致的 tags。成功的 TCP check 无法验证 UDS path,也不能证明 trace payloads 已被接受。不要使用 env | grep DD_:它可能披露 API/application keys 或 proxy credentials。
对于 logs,请检查实际 annotation/container identifier 和 file access,然后检查 collection exclusions、parsing 和 index filters。agent configcheck、status、 logs 和 archives 可能暴露 configuration 或 application data;在共享前检查并掩盖 outputs 中的敏感数据。
agent flare --local 会创建本地 bundle 以供检查。上传或 remote flare collection 是另一项需授权的 support action。内置敏感数据掩盖功能很有用, 但不能替代审查 archive 中应用程序所采集数据的工作。
验证范围
审计使用了 chart rendering 和官方 schema/source 检查、本地 DogStatsD Unix datagrams、在禁用 export/telemetry 的 Python 3.12 上使用 ddtrace 4.14.0 的 manual spans、 用于 Java 17 的 dd-trace-api 1.66.0 compilation 和 synchronous MDC tests,以及 API client 2.60.0 request models/serialization。这些检查未调用 Datadog tenant、未在 EKS 上安装、 未执行 admission webhook、未向 SaaS 发送 traces/logs、未创建 dashboards/monitors/ SLOs,也未测量 costs。
已针对文档说明的 metric units 和 aggregation rules 检查 monitor query 含义;未调用 Datadog query engine 或 Terraform provider plan。Grok request schema 不同于 live parsing。Applications、credentials、 traffic、runtime support 和 destination ownership 仍是部署前提条件。
参考资料
- Kubernetes 安装和版本前提条件
- Helm chart 3.244.0
- Agent 7.83.1 版本
- Kubernetes 发行版
- Kubelet 指标
- Kubernetes State Metrics Core
- 系统指标
- AWS 账户集成
- Admission Controller
- 本地 SDK 注入
- Kubernetes 上的 OpenMetrics
- DogStatsD UDS
- Python 追踪配置
- 自定义 instrumentation
- 日志解析
- as_count monitor 评估
- 基于指标的 SLO
- Datadog 定价和计费常见问题
- Agent flare 处理