Datadog
最終更新: October 12, 2026 Helm chart 3.244.0、対応する Agent/Cluster Agent 7.83.1。 構成、SDK、およびローカル検証の制限は以下に記載します。Datadog テナントは変更していません。
はじめに
Datadog は SaaS のオブザーバビリティバックエンドを提供します。チームは引き続き、collector、identity、 ネットワークアクセス、instrumentation、データ開示、保持、monitor、およびコストを管理します。 Infrastructure Monitoring、APM、profiling、logs、その他の製品には、それぞれ異なる 利用資格と課金ディメンションがあります。Agent をインストールしても、すべての製品が含まれるわけではありません。
| トピック | Datadog | CloudWatch | 自己管理 Prometheus / Grafana |
|---|---|---|---|
| バックエンド | サイト固有の可用性を持つ Datadog SaaS | AWS 管理サービス | 運用するストレージ、クエリ、可視化 |
| 収集 | Agent/Cluster Agent、ライブラリ、サポート対象の OTel パス | AWS サービスメトリクス、agents/SDKs/OTLP | Exporters、scraping、agents、remote write |
| APM/logs | 必要な製品を選択して構成 | Application Signals、tracing、Logs integrations | 関連するバックエンドと collectors を構成 |
| 運用 | collector/構成およびアプリケーションの責任は引き続き必要 | 収集/構成および対応の責任は引き続き必要 | バックエンドおよび収集の責任は引き続き必要 |
| コスト | Host およびその他の製品固有の使用量/保持単位 | Metric/observation/OTLP/log/query/alarm 単位 | インフラストラクチャと運用労力 |
組織とその認証情報に適した Datadog site を選択してください。API endpoint、データ所在地、 利用可能な製品、料金条件は site 間で交換可能ではありません。固定の integration 数の主張や 普遍的な「簡単/高度/安価」の順位付けではなく、integration catalogue を使用してください。
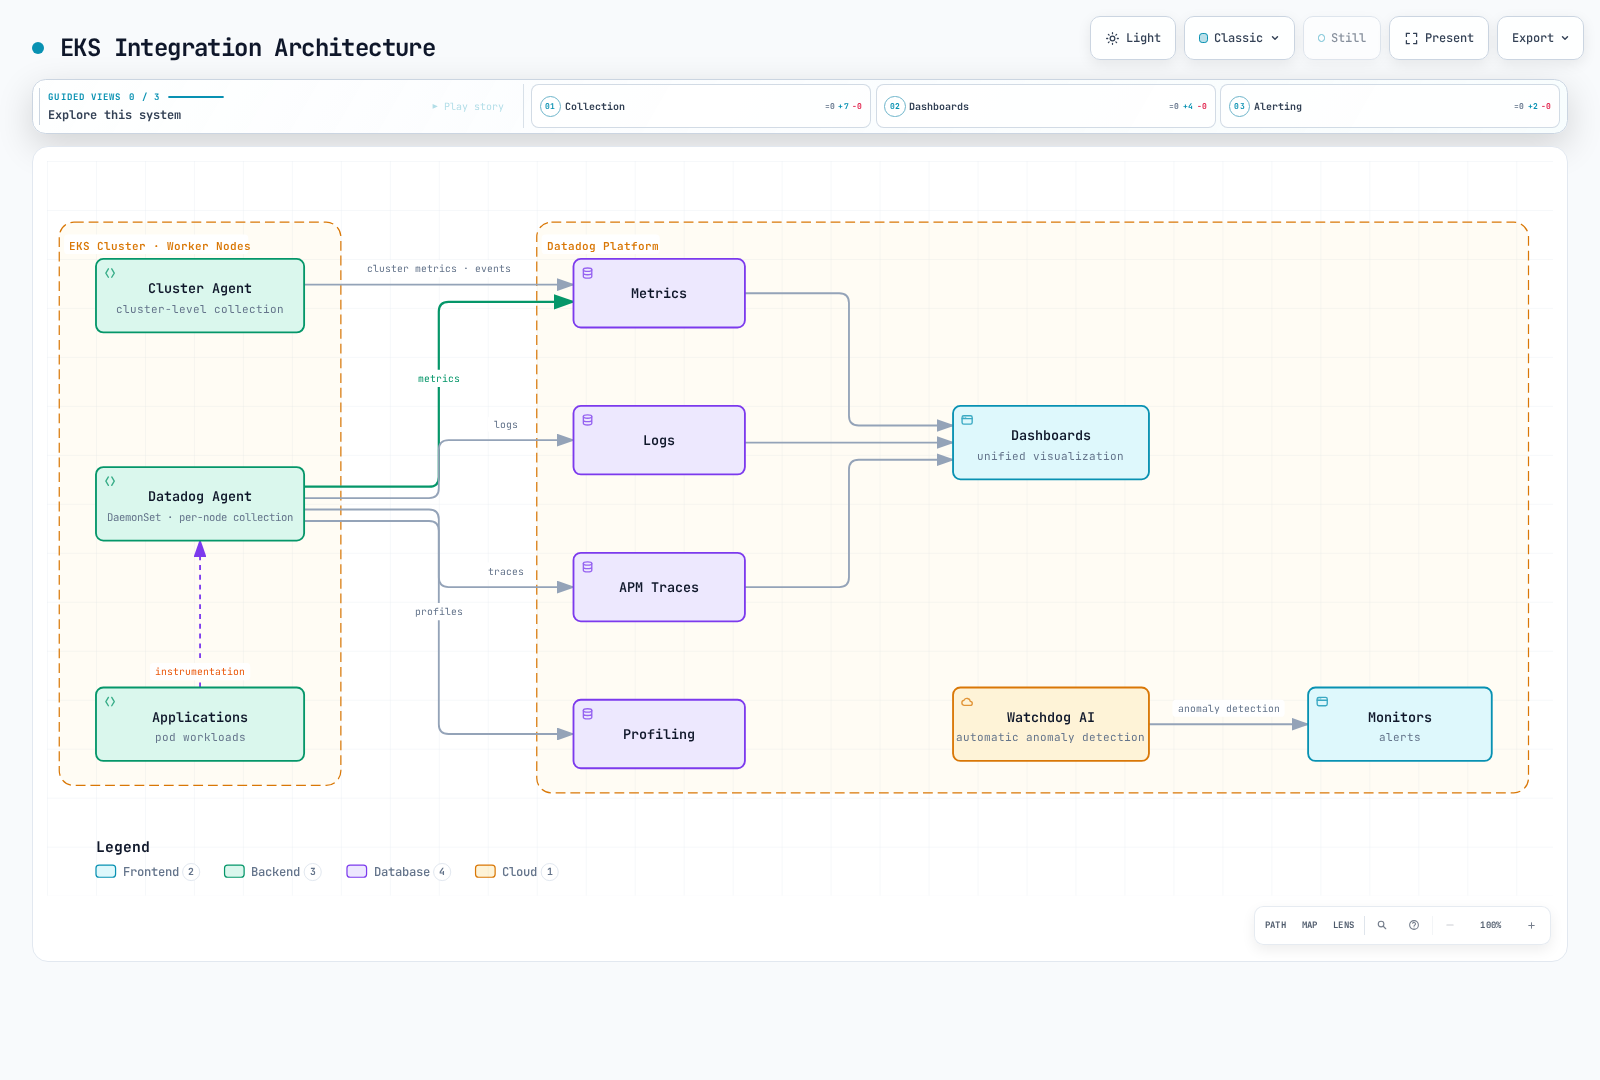
EKS integration architecture
| コンポーネント | 責任 / 境界 |
|---|---|
| Node Agent | Host/container の check。通常はサポート対象 EC2 node 上の DaemonSet |
| Cluster Agent | 共有 Kubernetes metadata/check、event coordination、任意の admission/external-metric 機能 |
| Trace Agent | アプリケーションの trace payload を受信して転送 |
| Process collection / system-probe | 独自の OS、権限、製品要件を持つ任意の process/network/security 機能 |
| Admission Controller | connection settings と、構成時にはサポート対象 client library を新しい Pod に inject |
アプリケーション instrumentation は traces/profiles を生成します。Agent listener または Pod label だけでは instrumentation を証明できません。Cluster Agent は通常の application-log や trace forwarding path ではありません。
この章のインストール対象は Linux EC2-backed EKS nodes です。EKS Fargate はこの host DaemonSet ではなく、文書化された Pod 単位/sidecar の collection model を使用します。UDS は host にローカルであり、 Windows ではサポートされません。Windows、Bottlerocket、Auto Mode、mixed compute には、それぞれの 配布/機能固有の設定とサポート対象 host access が必要です。TLS verification を無効にしたり、すべての eBPF/process 機能があらゆる場所で動作すると主張したりしないでください。
Datadog は、AllocatedResources を伴う Kubernetes 1.33+ 互換性について Agent および Cluster Agent 7.67+ を文書化し、両者のバージョンを一致させることを推奨しています。このような最小機能要件は、 現在の EKS support matrix ではありません。
概要は可能な collection path を示します。traces/profiles には application instrumentation と選択した製品が必要です。Watchdog notification routing は構成する必要があります。
Datadog Agent のインストール
Datadog は上位レベルの lifecycle configuration に Operator を推奨し、Helm インストールも サポートしています。この例では、Datadog Agent Helm chart で node/Cluster Agents を管理します。 Chart 3.244.0 には任意の Operator dependency が含まれています。datadog.operator.enabled: false は この例から追加の controller を除外しますが、Operator が廃止されたことを意味しません。
chart のデフォルトは Agent/Cluster Agent 7.82.3 です。この例では両方を 7.83.1 と検証済みの image-index digest に明示的に固定します。release には network-test billing、containerd snapshot cleanup、 Cluster Agent leader-lock shutdown の修正が含まれます。Agent/Cluster Agent image index には Linux amd64/arm64 が含まれます。template render の成功は Kubernetes deployment や runtime compatibility test ではありません。
認証情報とインストールの所有権
この profile は native aws.secrets backend を使用して、Datadog API key と共有 Cluster Agent token を AWS Secrets Manager から取得します。baseline ingestion に application key は不要です。external metrics は無効のままです。
ap-northeast-2 に JSON string key api-key と cluster-token を含む observability/datadog を準備してください。 token は暗号学的にランダムで、少なくとも 32 文字でなければなりません。API key は Datadog site に一致する必要があります。 namespace datadog の両方の ServiceAccounts、datadog と datadog-cluster-agent には、スコープを限定した IRSA roles、リージョンの STS/Secrets Manager 接続、および該当する場合は KMS permission が必要です。2 つの 例の role ARN を置き換えてください。EC2 metadata credential fallback は無効です。 完全な前提条件と再利用可能な profiles を参照してください。
その repository directory から Python 3/PyYAML 6.0.3 と実行可能な pinned-chart postrenderer を使用します。 これは、7 つの hardcoded SecretKeyRef entry を literal ENC[...] handles に正確に置き換え、node、trace、init、 Cluster Agent consumer を維持します。native resolution は environment ではなく in-memory configuration を更新します。 init script には空でない DD_API_KEY が必要なため、有効な replacement なしに削除すると startup が壊れます。 must-use-secret-postrenderer Secret は意図的に存在しません。省略された renderer を回避するために作成しないでください。 すべての install/upgrade で renderer を維持し、pinned chart、images、profile contract の変更をレビューしてください。
これらのコマンドが cluster を変更するのは installation 時のみです。IAM/secret 前提条件を準備した後、repository root の 既存の datadog namespace 内で、管理対象の release に対して実行してください。監査では deployment は実行していません。
PROFILE=examples/observability/secret-profiles
helm repo add datadog https://helm.datadoghq.com
helm repo update datadog
helm template datadog datadog/datadog --version 3.244.0 \
  --namespace datadog --include-crds -f "$PROFILE/datadog-values.yaml" \
  --post-renderer "$PROFILE/datadog_postrender.py" > datadog-reviewed-render.yaml
# Review resources and ownership first; retain the renderer on EVERY upgrade.
helm upgrade --install datadog datadog/datadog --version 3.244.0 \
  --namespace datadog -f "$PROFILE/datadog-values.yaml" \
  --post-renderer "$PROFILE/datadog_postrender.py"
レビュー済み values
以下は再利用可能な datadog-values.yaml と一致します。logs は container configuration による opt-in で、 APM/DogStatsD は UDS を使用します。cluster-wide automatic library injection、external HPA metrics、discovery network statistics、 任意の process/network collection はここでは有効にしていません。application namespace は Agent namespace と分離する必要があります。 SSI は Agent 自身の namespace 内の Pod を instrument しません。
# datadog 3.244.0: postrenderer required; replace example IRSA role ARNs.
targetSystem: linux
registry: gcr.io/datadoghq
datadog:
  apiKeyExistingSecret: must-use-secret-postrenderer
  clusterName: my-eks-cluster
  site: datadoghq.com
  tags:
  - env:demo
  - team:platform
  logs:
    enabled: true
    containerCollectAll: false
    containerCollectUsingFiles: true
  apm:
    socketEnabled: true
    portEnabled: false
    instrumentation:
      enabled: false
  dogstatsd:
    useSocketVolume: true
    useHostPort: false
    nonLocalTraffic: false
  processAgent:
    processCollection: false
    processDiscovery: false
    containerCollection: true
  networkMonitoring:
    enabled: false
  discovery:
    enabled: false
    networkStats:
      enabled: false
  autoscaling:
    workload:
      enabled: false
  profiling:
    enabled: null
  collectEvents: true
  prometheusScrape:
    enabled: false
  kubeStateMetricsCore:
    enabled: true
    collectSecretMetrics: false
    collectConfigMaps: false
  operator:
    enabled: false
  secretBackend:
    type: aws.secrets
    config:
      aws_session:
        aws_region: ap-northeast-2
    enableGlobalPermissions: false
  env: &id001
  - name: AWS_EC2_METADATA_DISABLED
    value: 'true'
  - name: DD_SECRET_REFRESH_INTERVAL
    value: '0'
  - name: DD_SECRET_REFRESH_ON_API_KEY_FAILURE_INTERVAL
    value: '0'
clusterAgent:
  enabled: true
  replicas: 2
  image:
    tag: 7.83.1
    digest: sha256:8e420c81e68abec34ab792c72a6513b739dcba8f7682c52e1e7e276363827b1a
  metricsProvider:
    enabled: false
    useDatadogMetrics: false
  admissionController:
    enabled: true
    mutateUnlabelled: false
  tokenExistingSecret: must-use-secret-postrenderer
  rbac:
    create: true
    serviceAccountAnnotations:
      eks.amazonaws.com/role-arn: arn:aws:iam::111122223333:role/datadog-cluster-agent-secrets
  env: *id001
agents:
  image:
    tag: 7.83.1
    digest: sha256:ed0bd588e955d82f661d1b8dd1cdf179c1023e74a2817e7a812c99d52f05c319
  rbac:
    create: true
    serviceAccountAnnotations:
      eks.amazonaws.com/role-arn: arn:aws:iam::111122223333:role/datadog-agent-secrets
postrendering 後の credential 関連 environment value は、ENC[observability/datadog;api-key] と ENC[observability/datadog;cluster-token] のみです。DD_SECRET_BACKEND_TYPE/CONFIG が含むのは backend type と region のみです。 shell が resolved value を export することはなく、実際の key は Helm values に置かれず、profile に Kubernetes credential Secret は不要です。 2 つの init-volume container は image configuration をコピーするだけです。init-config は bootstrap check に API-key handle を使用します。 実際の native backend authorization と Datadog ingestion には、引き続き runtime verification が必要です。
Scheduled および API-failure secret refresh は明示的に無効です。node/trace と Cluster Agent Pod を承認済みの協調 restart で rotate してください。fleet が新しい key を使用するまで、古い API key を有効に保ってください。cluster-token の変更は、mixed-version rollout 中に node/Cluster Agent authentication を中断する可能性があるため、maintenance window または別途検証済みの transition を計画してください。 zero-downtime rotation は主張していません。Datadog secret backends を参照してください。
processAgent.enabled は非推奨です。個別の collection options を使用してください。chart は該当する場合すでに /etc/passwd を mount するため、 重複する手動の passwd volumes/mounts を追加しないでください。resource overrides は agents.containers.agent.resources など component ごとです。 実際に render された containers を load 下でサイジングしてください。2 つの Cluster Agent replicas は placement、disruption、failure testing の代替にはなりません。
元の top-level kubeStateMetricsEnabled および prometheus.enabled entries は、主張された integrations を構成しません。 legacy KSM option は datadog の下にネストされます。この例では datadog.kubeStateMetricsCore.enabled を使用し、重複する legacy collection を避けています。 明示的な Datadog Autodiscovery checks は annotation-wide prometheusScrape を有効にすることとは別です。
datadog.profiling.enabled は有効です。これは eligible Pod に DD_PROFILING_ENABLED を inject し、installed client libraries と Cluster Agent 7.57+ を必要とします。 任意の uninstrumented application に profiler を install するものではありません。null/false/auto/true の動作を意図的に選択してください。 同様に、external HPA metrics を有効にするには application key、API permissions、service/CRDs、実際の metric availability が必要です。network monitoring にはサポート対象の system-probe access が必要です。
AWS account integration は別経路です
SaaS AWS account integration は、選択した integrations に必要な permissions を備えた authorized cross-account role と Datadog 提供の external ID を使用します。node Agent SA に付与された任意の IRSA role は、その SaaS integration を構成しません。 通常の Kubernetes Agent collection に、ここで以前示した広範な CloudWatch/EC2/tag policy は不要です。
実際に AWS を呼び出す Agent/check に対してのみ、Pod Identity または IRSA を、その固有の role、trust、permissions とともに使用してください。 render された service-account name を解決してください。推測した datadog-agent SA に IAM association を作成しても、Helm release が使用する 異なる SA は bind されません。local STS caller check を workload の identity の証明として扱わないでください。
Infrastructure Monitoring
metric の collector、unit、tags を確認する
| Metric / source | 意味 |
|---|---|
system.cpu.idle / System check | CPU idle percent。percentage-based node threshold に適切 |
system.mem.total, system.mem.used, system.mem.free | Memory measurements。free は usable/reclaimable memory と交換可能ではない |
kubernetes.cpu.usage.total / Kubelet | Nanocores であり percent ではない。1 core は 1,000,000,000 nanocores |
kubernetes.memory.usage, kubernetes.memory.limits | Bytes。usage と limit の比較には同一 entity/tag set の一致が必要 |
kubernetes.pods.running, kubernetes.containers.restarts | 有効な Kubelet gauges: running pods と累積 container restarts |
kubernetes_state.deployment.replicas_available, kubernetes_state.deployment.replicas_desired | Kubernetes State Metrics Core の Deployment state |
kubernetes_state.pod.status_phase, kubernetes_state.service.count | Pod phase/service inventory。文書化された grouping tags を確認 |
kubernetes_state.container.restarts | namespace/pod/container tags を持つ State Core の restart gauge |
legacy Kubernetes integration、Kubelet check、State Core には異なる catalogues があります。ある catalogue に metric がないことは、 必ずしも Agent から削除されたことを意味しません。有効な Kubelet metrics を無闇に rename しないでください。filesystem/network の可用性と rate units は collector/runtime に依存します。その metric の実際の definition を読んでください。
この Kubernetes installation には標準の kube_cluster_name tag を使用し、grouping 前に実際の metric tags を確認してください。 cluster-centric State Core metrics が常に host tag を持つとは限りません。cluster_name と kube_cluster_name は交換可能ではありません。 raw nanocore value を 80 と比較しても、80% CPU を意味しません。
OpenMetrics Autodiscovery
container 名が app で、port 9464 上に gauge queue_depth を提供する workload に、次の metadata fragment を merge してください。 これは application や endpoint を作成しません。annotation の container identifier は一致する必要があります。endpoint を保護し、必要に応じて TLS/authentication を構成してください。
metadata:
  annotations:
    ad.datadoghq.com/app.checks: "{\n  \"openmetrics\": {\n    \"init_config\": {},\n\
      \    \"instances\": [\n      {\n        \"openmetrics_endpoint\": \"http://%%host%%:9464/metrics\"\
      ,\n        \"namespace\": \"my_app\",\n        \"metrics\": [\n          {\n\
      \            \"queue_depth\": \"queue_depth\"\n          }\n        ]\n    \
      \  }\n    ]\n  }\n}"
現在の openmetrics check は openmetrics_endpoint を使用します。これらの Datadog Autodiscovery annotations には、 別の Prometheus server や chart の広範な prometheusScrape discovery は必要ありません。選択する metrics/labels を制限してください。 counters と histograms では、Prometheus name が最終的な Datadog name でもあると仮定せず、name normalization、emitted .count/bucket series、check-version behavior を検証してください。
DogStatsD: application から到達できる endpoint を使用する
application Pod の localhost は node Agent ではありません。Linux の例では host-local UDS directory を使用します。Admission Controller の socket mode は DD_DOGSTATSD_URL、DD_TRACE_AGENT_URL、volume を inject できます。それ以外の場合は、対応する mounts と permissions を 明示的に構成してください。Pod 固有の admission.datadoghq.com/config.mode は annotation ではなく label です。Agent restart 後の socket replacement が 引き続き見えるように parent directory を mount してください。
Python helper は datadog==0.53.0 で確認しました。socket_path には /var/run/datadog/dsd.socket のような実際の filesystem path を渡してください。 他の SDKs/environment settings で使用する unix:// URL は同じ argument format ではありません。zero の good/error values を含め、実際の interval counts で emit_batch を呼び出してください。
from datadog import DogStatsd


def emit_batch(client, total, errors):
    """Report one real interval; send zeros instead of omitting counters."""
    if any(isinstance(x, bool) or not isinstance(x, int) for x in (total, errors)):
        raise ValueError("counts must be integers")
    if not 0 <= errors <= total:
        raise ValueError("require 0 <= errors <= total")
    client.increment("requests.total", total)
    client.increment("requests.error", errors)
    client.increment("requests.good", total - errors)


# Create once in an application with the Agent's UDS directory mounted.
# This construction does not mean that the socket or receiving Agent is ready.
def make_metrics_client(socket_path):
    return DogStatsd(
        socket_path=socket_path,
        namespace="my_app",
        constant_tags=["env:demo", "service:orders"],
        disable_telemetry=True,
        disable_buffering=True,
    )
Go helper は datadog-go/v5 を使用します。WithNamespace("my_app.") と同じ env:demo,service:orders tags で client を作成してください。 constructor、send、close の errors を確認し、statsd.New error を破棄しないでください。この helper は caller から提供された shared client を close しません。
package metrics

import (
    "fmt"

    "github.com/DataDog/datadog-go/v5/statsd"
)

// The caller creates/reuses the client, checks New's error, and closes it at shutdown.
// For the Linux UDS example, use unix:///var/run/datadog/dsd.socket.
func EmitBatch(client *statsd.Client, total, errors int64) error {
    if errors < 0 || total < errors {
        return fmt.Errorf("require 0 <= errors <= total")
    }
    for _, item := range []struct {
        name string
        value int64
    }{
        {"requests.total", total},
        {"requests.error", errors},
        {"requests.good", total - errors},
    } {
        if err := client.Count(item.name, item.value, nil, 1); err != nil {
            return err
        }
    }
    return nil
}| DogStatsD type | 解釈 |
|---|---|
| Counter | Interval count。Datadog は rate として保存する場合がある。.as_count() は query window の counts を再構成する |
| Gauge | queue depth のような snapshot。snapshots の合計は processed-request count ではない |
| Histogram | 受信する Agent により集約される。host ごとの percentiles を平均しても global percentile にはならない |
| Distribution | backend distribution aggregation をサポートする。enabled percentiles、tags、billing を確認 |
| Service check | 実際の health check の status: 0 OK、1 warning、2 critical、3 unknown |
local datagram delivery は SaaS ingestion を acknowledge しません。UDP は packet を失う可能性があり、UDS/client buffering と Agent queues も monitoring が必要です。sample helper は DogStatsD client telemetry を有効にしないため、deployment には別の collection-health signal を選択してください。 Counter retries/duplicate sends は exactly-once business ledger ではありません。
File-based Autodiscovery configuration
Helm 管理の configuration では、datadog.confd が check files を作成して mount します。datadog-checks という名前の standalone ConfigMap は、 存在するだけでは自動的に discovered されません。次の NGINX fragment には、一致する image identity と構成済みで authorized な stub_status endpoint が必要です。
datadog:
  confd:
    nginx.yaml: "ad_identifiers:\n  - nginx\ninit_config: {}\ninstances:\n  - nginx_status_url:\
      \ http://%%host%%:80/nginx_status\n"
authenticated Redis check には、正しい port/TLS と credential delivery も必要です。%%env_REDIS_PASSWORD%% が読むのは Redis application Pod の environment ではなく Agent の environment です。構成済みの Datadog secret backend または必要な特定の permissions を持つ 保護された file delivery を優先してください。public check examples に passwords を露出したり、discovery のためだけに cluster-wide Secret reads を付与したりしないでください。
APM と Distributed Tracing
Local SDK injection と SSI は明示的な選択です
admission opt-in label は mutation/connection-setting injection を許可します。tracing library を install するには、SSI targets または サポート対象の language/version annotation を構成してください。label だけでは SDK が install されたことや traces が Datadog に到達したことの証明にはなりません。 Java/Python/Node.js local injection には Cluster Agent 7.40+、.NET/Ruby には 7.44+ が必要です。このガイドで固定する Cluster Agent 7.83.1 は、 kube-system と自身の namespace も injection から除外します。
制御された Java の例では、既存の Deployment の selector、containers、security settings を維持したまま、application namespace の Deployment に 次の pod-template fragment を merge してください。単独で apply する完全な Deployment ではありません。Java init image gcr.io/datadoghq/dd-lib-java-init:v1.66.0 は Linux amd64/arm64 で検証済みです。実際の application's JVM/framework/image compatibility を確認してください。
spec:
  template:
    metadata:
      labels:
        admission.datadoghq.com/enabled: 'true'
        admission.datadoghq.com/config.mode: socket
        tags.datadoghq.com/env: demo
        tags.datadoghq.com/service: orders
        tags.datadoghq.com/version: 1.0.0
      annotations:
        admission.datadoghq.com/java-lib.version: v1.66.0
tags.datadoghq.com/* labels は unified service/environment/version tagging を提供します。label を Deployment metadata のみに置いて、 その Pod が継承すると期待しないでください。injection は new pods が admitted されたときに行われます。injected init containers、library files、 UDS mounts/permissions、non-secret connectivity settings を確認してから、実際の traffic/traces を検証してください。namespace exclusions、webhook failures、 security policies、unsupported images により instrumentation が妨げられる可能性があります。
cluster-wide SSI は、レビュー済みの namespace/pod targets と library versions を伴う datadog.apm.instrumentation で構成する代替手段です。 manual と injected tracers を意図せず組み合わせないでください。injected library は manually installed なものより優先されることがあります。 Profiler enablement には、引き続きサポート対象 client library と独自の product/runtime conditions が必要です。
Manual Java instrumentation
application JVM の起動時には、staged で versioned な dd-java-agent.jar、または上記の validated injection route を使用してください。 単に dd-trace-api を追加しても annotation/API にはアクセスできますが、runtime bytecode instrumentation は開始しません。 以下の Maven dependency と Java source は別の files です。
<dependency>
  <groupId>com.datadoghq</groupId>
  <artifactId>dd-trace-api</artifactId>
  <version>1.66.0</version>
</dependency>import java.util.function.Supplier;
import datadog.trace.api.Trace;
public final class TraceMethods {
private TraceMethods() {}
@Trace(operationName = "order.process", resourceName = "process_order")
public static <T> T process(Supplier<T> handler) {
return handler.get();
}
}handler は caller から提供される application code を表します。operation/resource names は bounded にしてください。古い例の order/customer identifier ごとの tags は、このデモには不要であり、disclosure/cardinality risks を生み出す可能性があります。manual span APIs には対応するサポート対象 bridge/library が必要です。 annotation API しかない project に OpenTracing imports を追加しないでください。
Manual Python instrumentation
この確認済みの 4.14.0 の例には、現在の ddtrace.trace import を使用してください。dependency declaration は Python code block 内ではなく requirements.txt に置いてください。framework auto-instrumentation では、application imports の前に選択した ddtrace-run/SSI setup に従ってください。 この helper が framework 全体を patch すると仮定しないでください。
ddtrace==4.14.0from ddtrace.trace import tracer
def process_order(handler):
with tracer.trace("order.process", service="orders", resource="process_order") as span:
span.set_tag("operation.kind", "order")
return handler()同等の tracer.wrap decorator は method tracing に使用できます。handler からの exceptions は propagate する必要があります。span の記録は application retry や成功の保証ではありません。サポート対象 HTTP/message integrations をまたぐ正しい service/env/version tags と context propagation を使用してください。 Service maps は観測された instrumented relationships から作られ、任意の DD_TAGS だけからは作られません。
raw customer/order identifiers、tokens、request bodies をデフォルトで tag しないでください。実際の application について instrumentation capture、 error messages、sampling/redaction rules をレビューしてください。auto-instrumentation は完全な PII removal を保証しません。
Log Management
collection と parsing を意図的に選択する
installation は log collection を有効にしますが、containerCollectAll: false のままにします。container 名が app の pod template に この metadata を merge してください。multiline rule は date で始まる plain-text Java records に適用されます。一般的な JSON-log parser ではありません。 container runtime framing と application message parsing は別々の stages です。実際に collected records を確認してください。
metadata:
  annotations:
    ad.datadoghq.com/app.logs: "[\n  {\n    \"source\": \"java\",\n    \"service\"\
      : \"orders\",\n    \"log_processing_rules\": [\n      {\n        \"type\": \"\
      multi_line\",\n        \"name\": \"java_timestamp_start\",\n        \"pattern\"\
      : \"^\\\\d{4}-\\\\d{2}-\\\\d{2}\"\n      }\n    ]\n  }\n]"
1 行につき 1 JSON event の applications では、この rule で無関係な JSON events を join するのではなく、サポート対象の JSON path を使用してください。 file access、runtime paths、annotation matching、exclusion settings、backend pipeline filters はすべて collection に影響します。 matching application と excluded one の両方で selective collection を確認してください。
Pipeline request structure
この request は実際の API fields match_rules と support_rules を使用します。古い camelCase fields は Logs API model ではありません。 sample message は期待する line format を定義しています。application の実際の format/timezone を使用し、unmatched/multiline/error cases を test してください。 valid request model は Datadog tenant における Grok parsing や ingestion/indexing を証明しません。
{
  "name": "Java application logs",
  "is_enabled": true,
  "filter": {
    "query": "source:java service:orders"
  },
  "processors": [
    {
      "type": "grok-parser",
      "name": "Parse the documented Java line format",
      "is_enabled": true,
      "source": "message",
      "samples": [
        "2026-09-13 12:00:00,123 INFO [main] example.Service - completed"
      ],
      "grok": {
        "support_rules": "",
        "match_rules": "java_log %{date(\"yyyy-MM-dd HH:mm:ss,SSS\"):timestamp} %{word:level} \\[%{notSpace:thread}\\] %{notSpace:logger} - %{data:message}"
      }
    },
    {
      "type": "status-remapper",
      "name": "Use level as status",
      "is_enabled": true,
      "sources": [
        "level"
      ]
    },
    {
      "type": "date-remapper",
      "name": "Use parsed timestamp",
      "is_enabled": true,
      "sources": [
        "timestamp"
      ]
    }
  ]
}
Pipeline の creation/reordering は matching logs の processing を変更します。正しい site、scoped API permissions、既存の pipeline ownership の下で構成してください。 この監査では pipeline request は送信していません。
Trace-log correlation と MDC ownership
可能な場合はサポート対象の automatic log injection を使用し、structured logs では trace/span IDs を strings として保持してください。 正しい service/env/version、timestamps、parsing、利用可能な trace data も必要です。2 つの ID fields だけでは correlation を保証しません。 process が instrumented されていない場合に有用な active trace ID はありません。
SLF4J MDC を明示的に管理する applications では、この helper は success と failure の両方で caller の previous context 全体 を復元します。 古い無条件の MDC.clear() は無関係な caller fields を失っていました。これは synchronous helper であり、async context propagation mechanism や完全な servlet filter ではありません。
import java.util.Map;
import java.util.function.Supplier;
import datadog.trace.api.CorrelationIdentifier;
import org.slf4j.MDC;

public final class TraceLogContext {
    private TraceLogContext() {}

    public static <T> T withTraceContext(Supplier<T> handler) {
        Map<String, String> previous = MDC.getCopyOfContextMap();
        try {
            MDC.put("dd.trace_id", CorrelationIdentifier.getTraceId());
            MDC.put("dd.span_id", CorrelationIdentifier.getSpanId());
            return handler.get();
        } finally {
            if (previous == null) {
                MDC.clear();
            } else {
                MDC.setContextMap(previous);
            }
        }
    }
}
これには dd-trace-api と application に対応する SLF4J API/provider が必要です。logging pattern または JSON encoder に MDC values を含める必要があります。 servlet API、imports、checked-exception contract がないまま servlet example をコピーしないでください。
Dashboards と Alerts
Dashboard request construction
この helper は request body の構築に datadog-api-client==2.60.0 を使用します。cluster と namespace template variables は実際に queries から参照されます。 host widget は percent metric を使用し、pod widget は memory bytes とその namespace filter を使用します。選択した data が本当に grouping tags を持つことを確認してください。
from datadog_api_client.v1.model.dashboard import Dashboard
from datadog_api_client.v1.model.dashboard_layout_type import DashboardLayoutType


def build_dashboard(cluster_name):
    return Dashboard(
        title="EKS observability example",
        layout_type=DashboardLayoutType.ORDERED,
        widgets=[
            {"definition": {
                "type": "timeseries",
                "title": "CPU idle by host (%)",
                "requests": [{"q": "avg:system.cpu.idle{$cluster} by {host}", "display_type": "line"}],
            }},
            {"definition": {
                "type": "toplist",
                "title": "Top 10 pod memory series by mean (bytes)",
                "requests": [{"q": "top(sum:kubernetes.memory.usage{$cluster,$namespace} by {pod_name,kube_namespace}, 10, 'mean', 'desc')"}],
            }},
        ],
        template_variables=[
            {"name": "cluster", "prefix": "kube_cluster_name", "default": cluster_name},
            {"name": "namespace", "prefix": "kube_namespace", "default": "*"},
        ],
    )
caller は正しく構成された ApiClient を提供し、意図した dashboard を create または update するために DashboardsApi を使用します。 返された ID を記録/reconcile してください。title による繰り返し作成では duplicates が生じる可能性があります。site と scoped automation credentials は node Agent API key とは別です。 この監査では dashboard API は呼び出していません。
Monitor queries と units
構成済みの Datadog Terraform provider と project version constraints/lock file を使用してください。これらは resource fragments であり、完全な provider/credential setup ではありません。 thresholds は例です。実際の metric units、tags、windows、application objectives を確認してください。最初の monitor は nanocores を 80 と比較して結果を「CPU percent」と呼ぶのではなく、 idle percent を直接評価します。
# Fragments for a configured, version-pinned Datadog Terraform provider.
# Replace notification destinations with approved, tested destinations.
resource "datadog_monitor" "low_cpu_idle" {
  name    = "Low CPU idle on EKS nodes"
  type    = "metric alert"
  message = "CPU idle on {{host.name}} is {{value}}%. Inspect the host and collection health."
  query   = "avg(last_5m):avg:system.cpu.idle{kube_cluster_name:my-eks-cluster} by {host} < 20"
  monitor_thresholds {
    warning  = 30
    critical = 20
  }
  require_full_window = false
  notify_no_data      = false
  tags               = ["env:demo", "team:platform"]
}

resource "datadog_monitor" "restart_total" {
  name    = "Container restart total exceeds example threshold"
  type    = "metric alert"
  message = "Inspect {{pod_name.name}} / {{kube_container_name.name}}. This is a restart total, not a count of new restarts in five minutes."
  query   = "max(last_5m):max:kubernetes_state.container.restarts{kube_cluster_name:my-eks-cluster} by {pod_name,kube_namespace,kube_container_name} > 3"
  monitor_thresholds {
    warning  = 2
    critical = 3
  }
  require_full_window = false
  notify_no_data      = false
  tags               = ["env:demo", "team:platform"]
}

resource "datadog_monitor" "request_error_rate" {
  name    = "High request error ratio"
  type    = "metric alert"
  message = "Error ratio for {{service.name}} is {{value}}%. Check traffic volume and the reporting path."
  query   = "sum(last_5m):sum:my_app.requests.error{env:demo} by {service}.as_count() / sum:my_app.requests.total{env:demo} by {service}.as_count() * 100 > 5"
  monitor_thresholds {
    warning  = 2
    critical = 5
  }
  require_full_window = false
  notify_no_data      = false
  tags               = ["env:demo", "type:application"]
}
restart gauge は total です。2 つの windows の repeated gauge samples の sums を比較しても、特に resets、replacement pods、不均等な sampling がある場合、 新しい restarts を信頼性高く数えられません。recent-restart monitor には検証済みの delta/reset design が必要です。この例では代わりに total について明示的に alert します。
error monitor は explicit zero values を含め、emit_batch が出力する 3 つの counters を使用します。.as_count() evaluation では、 time aggregation は division より前に行われます。各 time bucket の ratio の sum ではなく sum(errors)/sum(total) です。この path では sum aggregator を使用してください。
zero traffic、missing telemetry、実際に error-free な traffic は異なります。minimum traffic/collection-health conditions を定義し、monitor の no-data behavior を検証してください。 notify_no_data: false は health を確立するものではなく、これらの fragments で missing data を通知しないだけです。
built-in APM metrics では、選択した integration が生成した実際の trace.<operation>.hits/errors names と tags を使用してください。 Java、Python、その他の integrations がすべて trace.http.request.* を出力するわけではありません。Trace analytics、generated trace metrics、custom DogStatsD metrics は異なる sources です。
Watchdog と notification delivery
Watchdog はすべての threshold を手動で選ばずに、detected anomalies/insights を表示できます。insight は notification が delivered された証明ではありません。 サポート対象の Watchdog/monitor workflow を使用し、意図した site で event source、product availability、notification routing を確認してください。
次の event-monitor fragment は、その organization に source:watchdog と一致する actual events が存在することを前提とします。 story_category group tag を作り出したり、すべての Watchdog result がこの stream に現れることを保証したりはしません。notifications を有効にする前に real events に対して filter を検証してください。
resource "datadog_monitor" "watchdog_events" {
  name    = "Review matching Watchdog events"
  type    = "event-v2 alert"
  message = "Review the matching Watchdog event and affected services. Add an approved notification destination."
  query   = "events(\"source:watchdog\").rollup(\"count\").last(\"5m\") > 0"
  tags    = ["env:demo", "type:watchdog"]
}
SLO request construction
metric-based SLOs には、明確に定義された good/total counts が必要です。以下の helper は上記の explicit counters を使用します。 「Good」は application's SLI policy に一致する必要があります。HTTP 2xx だけを数えることは普遍的な availability definition ではありません。 absence を 100% success と扱うのではなく、zero-traffic と missing-data behavior を検証してください。
from datadog_api_client.v1.model.service_level_objective_request import ServiceLevelObjectiveRequest


def build_success_slo():
    return ServiceLevelObjectiveRequest(
        name="Orders successful-request SLO",
        type="metric",
        description="Successful requests divided by all reported requests",
        query={
            "numerator": "sum:my_app.requests.good{env:demo,service:orders}.as_count()",
            "denominator": "sum:my_app.requests.total{env:demo,service:orders}.as_count()",
        },
        thresholds=[{"timeframe": "30d", "target": 99.9, "warning": 99.95}],
        tags=["env:demo", "service:orders"],
    )
これは request を構築するもので、live SLO ではありません。ownership、data、permissions を検証した後、構成済みの caller はこれを ServiceLevelObjectivesApi.create_slo に渡せます。Datadog は monitor-based および time-slice SLOs もサポートします。gauge/restart total を good-event count に無理に当てはめるのではなく、SLI に一致する model を選択してください。
Cost Structure
実際の product と contract units を使用する
| コンポーネント | 見積もりの入力 |
|---|---|
| Infrastructure | 課金対象 hosts/containers または該当する platform model、plan、commitment terms |
| APM | 課金対象 APM hosts と選択した plan/model、included allotments、ingested および indexed spans |
| Logs | Ingested volume に加え indexing/retention/search/archive の選択 |
| Custom metrics / distributions | 異なる metric/tag combinations、enabled aggregations、該当する included volumes |
| Additional products | Profiling、network/security、serverless、その他の enabled product charges |
すべての product を普遍的な Free/Pro/Enterprise table にまとめないでください。pricing page は products、annual/on-demand terms、 attached versus standalone offerings を区別しています。infrastructure metrics、searchable traces、indexed logs の retention は、 共通の「15-month」設定ではありません。
以前の 100-node の例では、50 services は 50 APM hosts を意味しません。host-priced agreement では、まず実際の課金対象 Infrastructure と APM host counts を決定してください。30 日間で 100 GB/day の場合、log ingestion は 3,000 GB ですが、ingestion だけが total log bill ではありません。
Estimated cost =
  billable infrastructure units × applicable rate
  + billable APM units × applicable rate
  + ingested/indexed span overages under the contract
  + 3,000 GB × applicable log-ingestion rate
  + indexed events/retention/search/archive charges
  + custom-metric and other enabled-product charges
以前の約 $3,350 の total は不一致の APM units を使用し、課金対象 dimensions を省略していました。これは測定された production bill ではありません。 その見積もりを budget guarantee として扱うのではなく、現在の site/product quote と測定された usage を使用してください。
Metrics、logs、trace controls は異なることを行う
dogstatsd.nonLocalTrafficは receiver reachability を制御します。custom-metric quota ではありません。receiver を閉じると telemetry を失うだけの場合があります。ignoreAutoConfigは選択した automatic checks を無効にします。container exclusion filters は containers を選択します。どちらも一般的な tag-cardinality limiter ではありません。collection owner で allowed metrics と tag values をレビューしてください。origin tag cardinality を変更すると利用可能な grouping tags が変わる可能性があるため、monitors/SLOs を再確認してください。
source-side log exclusion は選択した records の送信を回避します。index exclusion は後で行われ、ingestion costs を消去しません。incident evidence と failures を保持してください。結果にかかわらずすべての health-check line を drop しないでください。
sampling と indexing/retention は別です。
DD_TRACE_SAMPLE_RATEまたは sampling rules は library/version と matching scope に依存します。 文書化された PythonDD_TRACE_RATE_LIMITは process ごとで、構成された sampling rules/rate とともに適用されます。cluster-wide や dollar cap ではありません。 10% trace rate は Datadog bill 全体の 90% reduction を意味しません。
Best Practices
一貫した service/env/version labels と bounded tags を使用し、API-key ingestion と application-key automation permissions を分離してください。 すべての logs、process arguments、profiles を収集する前に application capture と secret/redaction paths をレビューしてください。 collector queues/drops を monitor し、filters を変更した後に real outputs を検証してください。
operating team と alert severity、ownership、response targets について合意してください。runbook 内の P1/P2 labels は operational policy であり、 単独の Datadog resource definitions ではありません。actual destinations、missing data、recovery notifications を test してください。 sample に現れるという理由だけで thresholds を選ぶのではなく、文書化された SLI/SLO と traffic context を使用してください。
トラブルシューティング
installation owner、actual pod/container names、intended site から始めてください。literal native-backend handles、Secrets Manager IRSA、必要な postrenderer、 Agent/Cluster Agent health、Kubelet/RBAC access、scrape configuration、queued/dropped telemetry を確認してください。この release の render 済み node Agent pod には agent と trace-agent containers があります。古い app=datadog selector は current labels を確認する信頼できる代替ではありません。
kubectl get pods -n datadog \
  -l app.kubernetes.io/instance=datadog,app.kubernetes.io/component=agent -o wide

# Select the actual node Agent pod after inspecting the list.
: "${DD_AGENT_POD:?Set the node Agent pod name}"
kubectl exec -n datadog "$DD_AGENT_POD" -c agent -- agent status
kubectl logs -n datadog "$DD_AGENT_POD" -c agent --tail=100
kubectl logs -n datadog "$DD_AGENT_POD" -c trace-agent --tail=100

# Check new application pods without dumping credentials/environment values.
: "${APP_NAMESPACE:?Set the application namespace}"
: "${APP_POD:?Set the application pod name}"
kubectl get pod -n "$APP_NAMESPACE" "$APP_POD" \
  -o jsonpath='{.spec.initContainers[*].image}'
kubectl get pod -n "$APP_NAMESPACE" "$APP_POD" \
  -o jsonpath='{range .spec.containers[*]}{.name}{": "}{.env[*].name}{"\n"}{end}'

# Create a local diagnostic archive only; review it before any authorized sharing.
kubectl exec -n datadog "$DD_AGENT_POD" -c agent -- agent flare --local
traces では、実際の library injection/startup、socket または host endpoint、permissions、一貫した tags を検証してください。 successful TCP check は UDS path を検証せず、accepted trace payloads を証明しません。env | grep DD_ を使用しないでください。API/application keys や proxy credentials を開示する可能性があります。
logs では、actual annotation/container identifier と file access、次に collection exclusions、parsing、index filters を確認してください。 agent configcheck、status、logs、archives は configuration や application data を露出する可能性があります。共有する前に outputs を確認し、機密データを隠してください。
agent flare --local は inspection 用の local bundle を作成します。upload または remote flare collection は、別の authorized support action です。 built-in redaction は有用ですが、application が収集したデータについて archive をレビューすることの代わりにはなりません。
検証範囲
この監査では、chart rendering と official schema/source inspection、local DogStatsD Unix datagrams、export/telemetry を無効にした Python 3.12 上の ddtrace 4.14.0 manual spans、Java 17 向け dd-trace-api 1.66.0 compilation と synchronous MDC tests、API client 2.60.0 request models/serialization を使用しました。これらの checks は Datadog tenant の呼び出し、EKS へのインストール、admission webhook の実行、SaaS への traces/logs の送信、 dashboards/monitors/SLOs の作成、costs の測定を行っていません。
monitor query の意味は文書化された metric units と aggregation rules に照らして確認しました。Datadog query engine や Terraform provider plan は呼び出していません。 Grok request schema は live parsing とは別です。applications、credentials、traffic、runtime support、destination ownership は deployment prerequisites のままです。
参考資料
- Kubernetes installation and version prerequisites
- Helm chart 3.244.0
- Agent 7.83.1 release
- Kubernetes distributions
- Kubelet metrics
- Kubernetes State Metrics Core
- System metrics
- AWS account integration
- Admission Controller
- Local SDK injection
- OpenMetrics on Kubernetes
- DogStatsD UDS
- Python tracing configuration
- Custom instrumentation
- Log parsing
- as_count monitor evaluation
- Metric-based SLOs
- Datadog pricing and billing FAQs
- Agent flare handling