メトリクスの概要
最終更新: September 13, 2026. 例は Prometheus 3.14.0 ツールでローカルに確認しました。cluster または cloud へのデプロイは実行していません。
目次
メトリクスの基礎
メトリクスはシステムの状態と動作を数値で表します。メトリクス名と完全なラベルセットによって時系列が識別され、各サンプルは値とタイムスタンプを追加します。メトリクスは alerting、トラブルシューティング、capacity planning、パフォーマンス分析を支援しますが、サンプリングされた測定値は個々のすべてのイベントを保持するものではありません。
たとえば、http_requests_total はリクエスト counter の名前であり、method="GET" と status="200" は母集団を区別します。サンプル値は累積カウントです。job や instance などの target ラベルは、通常 scraping 中に追加されます。
タイムスタンプは形式に依存します。従来の Prometheus text exposition の明示的なタイムスタンプは Unix ミリ秒である一方、OpenMetrics は Unix 秒を使用します。exporter は通常、明示的なサンプルタイムスタンプを省略するため、Prometheus が scrape 時刻を割り当てます。1 つの単位をすべての telemetry protocol で共通のものとして扱わないでください。
命名と単位
| 例 | 解釈 |
|---|---|
http_requests_total | Counter。_total は物理単位ではなく累積カウントを示す |
http_request_duration_seconds | 基本単位での期間 |
node_memory_MemAvailable_bytes | 既存の node-exporter メトリクス。公開されている表記を維持する |
requests | 新しい application メトリクスとしてはコンテキストが不足している |
httpRequestDurationMs | 単位は含まれるが、camelCase と、一般的な Prometheus の命名/基本単位の規則ではなくミリ秒を使用している |
新しいメトリクスでは、説明的な prefix、underscore で区切った小文字の語、_seconds や _bytes などの単位を優先してください。命名規則は exporter の確立済み API の名前変更を許可するものではありません。
以下の text block は合成された Prometheus text exposition であり、YAML ではありません。query expression は別の promql block です。query selector は表示されている scrape-job 名を想定しているため、実際の target ラベルに合わせて調整してください。
メトリクスの種類
Prometheus client library は通常、Counter、Gauge、Histogram、Summary を公開します。たまたまそのサンプルを受け入れる query ではなく、測定値の意味に基づいて種類を選択してください。
1. Counter
counter は、リクエスト、error、完了した task などの非負の増分を累積します。測定対象の process/state が再作成されると reset されることがあります。exporter の再起動のすべてが基礎となる counter の reset を必ず引き起こすわけではありません。
# TYPE http_requests_total counter
http_requests_total{method="GET",endpoint="/api/users",status="200"} 12345
http_requests_total{method="POST",endpoint="/api/users",status="500"} 23
series ごとの rate、service 全体の rate、および推定 increase:
rate(http_requests_total{job="example-app"}[5m])sum(rate(http_requests_total{job="example-app"}[5m]))increase(http_requests_total{job="example-app"}[1h])rate() は観測された counter reset を考慮し、要求された window にわたって外挿します。観測間で失われた増分は復元できません。そのため、整数 counter であっても increase() は小数の推定値を返すことがあります。ある instance の reset が別の instance の増加によって隠れないよう、集約する前に rate() を適用してください。
2. Gauge
gauge は現在の状態を表し、増加も減少もします。これらの値は、application 定義の temperature メトリクスとともに、実際の node-exporter および kube-state-metrics の名前を示しています。
# TYPE node_memory_MemAvailable_bytes gauge
node_memory_MemAvailable_bytes 8589934592
# TYPE node_memory_MemTotal_bytes gauge
node_memory_MemTotal_bytes 17179869184
# TYPE kube_pod_status_ready gauge
kube_pod_status_ready{namespace="example-app",pod="example-0",uid="00000000-0000-4000-8000-000000000001",condition="true"} 1
# TYPE temperature_celsius gauge
temperature_celsius{location="datacenter-1"} 23.5100 * (1 - node_memory_MemAvailable_bytes{job="node-exporter"} / node_memory_MemTotal_bytes{job="node-exporter"})max_over_time(temperature_celsius{job="example-app"}[1h])memory expression は MemAvailable として報告されない割合であり、application の resident-memory 測定値ではありません。Pod readiness は特定の condition series を使用します。condition="false" での値 1 は、condition="true" での値 1 とは異なる意味を持ちます。
3. Histogram
classic histogram は、計装された application/exporter 内で observation を累積 bucket にカウントします。Prometheus は後で quantile を計算します。le は含まれる上限値であり、+Inf bucket は _count と等しくなります。
# TYPE http_request_duration_seconds histogram
http_request_duration_seconds_bucket{le="0.005"} 24054
http_request_duration_seconds_bucket{le="0.01"} 33444
http_request_duration_seconds_bucket{le="0.025"} 100392
http_request_duration_seconds_bucket{le="0.05"} 129389
http_request_duration_seconds_bucket{le="0.1"} 133988
http_request_duration_seconds_bucket{le="0.25"} 144320
http_request_duration_seconds_bucket{le="+Inf"} 144320
http_request_duration_seconds_sum 4800.8625
http_request_duration_seconds_count 144320
これは benchmark ではなく、例示的な分布です。その 144,320 observation の合計は 4,800.8625 秒です。以前の合計である 53.42 秒は、表示された bucket count と整合しませんでした。これらは 2,704 秒を超える下限を示しています。有限の 0.25 秒 bucket により、この例の p95 が非有界 bucket のみに入ることも防ぎます。
一致する bucket layout に対する fleet 全体の p95 と平均値:
histogram_quantile(0.95, sum by (le) (rate(http_request_duration_seconds_bucket{job="example-app"}[5m])))sum(rate(http_request_duration_seconds_sum{job="example-app"}[5m])) / sum(rate(http_request_duration_seconds_count{job="example-app"}[5m]))classic bucket を集約する際は le を維持してください。quantile は bucket 内で補間され、その精度は分布と bucket 解像度に依存します。classic bucket 境界の変更は、query のみの編集ではなく計装の変更です。
native histogram は分布を異なる方法で表します。現在の Prometheus ガイダンスでは、client、scrape protocol、storage/query pipeline が対応している場合にこれを優先します。パス全体で互換性と設定を確認してください。ここでの classic の例は native-histogram wire output ではありません。
4. Summary
summary は、client-side window で設定済みの quantile を計算することがあります。それらの値は一般にアルゴリズム/window 依存の誤差を伴う近似値であり、正確な quantile ではありません。library のサポートは異なります。Summary 実装は sum/count のみを公開する場合があります。
# TYPE rpc_request_duration_seconds summary
rpc_request_duration_seconds{quantile="0.5"} 0.052
rpc_request_duration_seconds{quantile="0.9"} 0.089
rpc_request_duration_seconds{quantile="0.99"} 0.245
rpc_request_duration_seconds_sum 29969.50
rpc_request_duration_seconds_count 562887rpc_request_duration_seconds{job="example-app",quantile="0.99"}sum(rate(rpc_request_duration_seconds_sum{job="example-app"}[5m])) / sum(rate(rpc_request_duration_seconds_count{job="example-app"}[5m]))最初の expression は、一致する各 instance が報告した p99 を返します。それらの p99 値を平均または合計しても fleet の p99 にはなりません。2 番目の expression は、非負の期間の _sum および _count rate を正当に集約して fleet の平均を計算します。
| 質問 | Classic Histogram | quantile を含む Summary |
|---|---|---|
| 分布はどこで処理されるか? | 計装時に bucket、query 時に quantile | 計装時に quantile |
| instance を結合できるか? | 互換性のある bucket は集約できる | quantile は不可。sum/count は可能 |
| 誤差が依存するもの | bucket 解像度と observation | client algorithm、objective、time window |
| 後で異なる percentile/window を query できるか? | 保持された bucket sample から可能 | 事前計算された quantile だけからは不可 |
traffic がゼロの場合、平均は NaN になることがあります。series が存在しない場合は空の結果になることがあります。どちらも健全な traffic の証拠として暗黙に扱うべきではありません。
Pull モデルと Push モデル
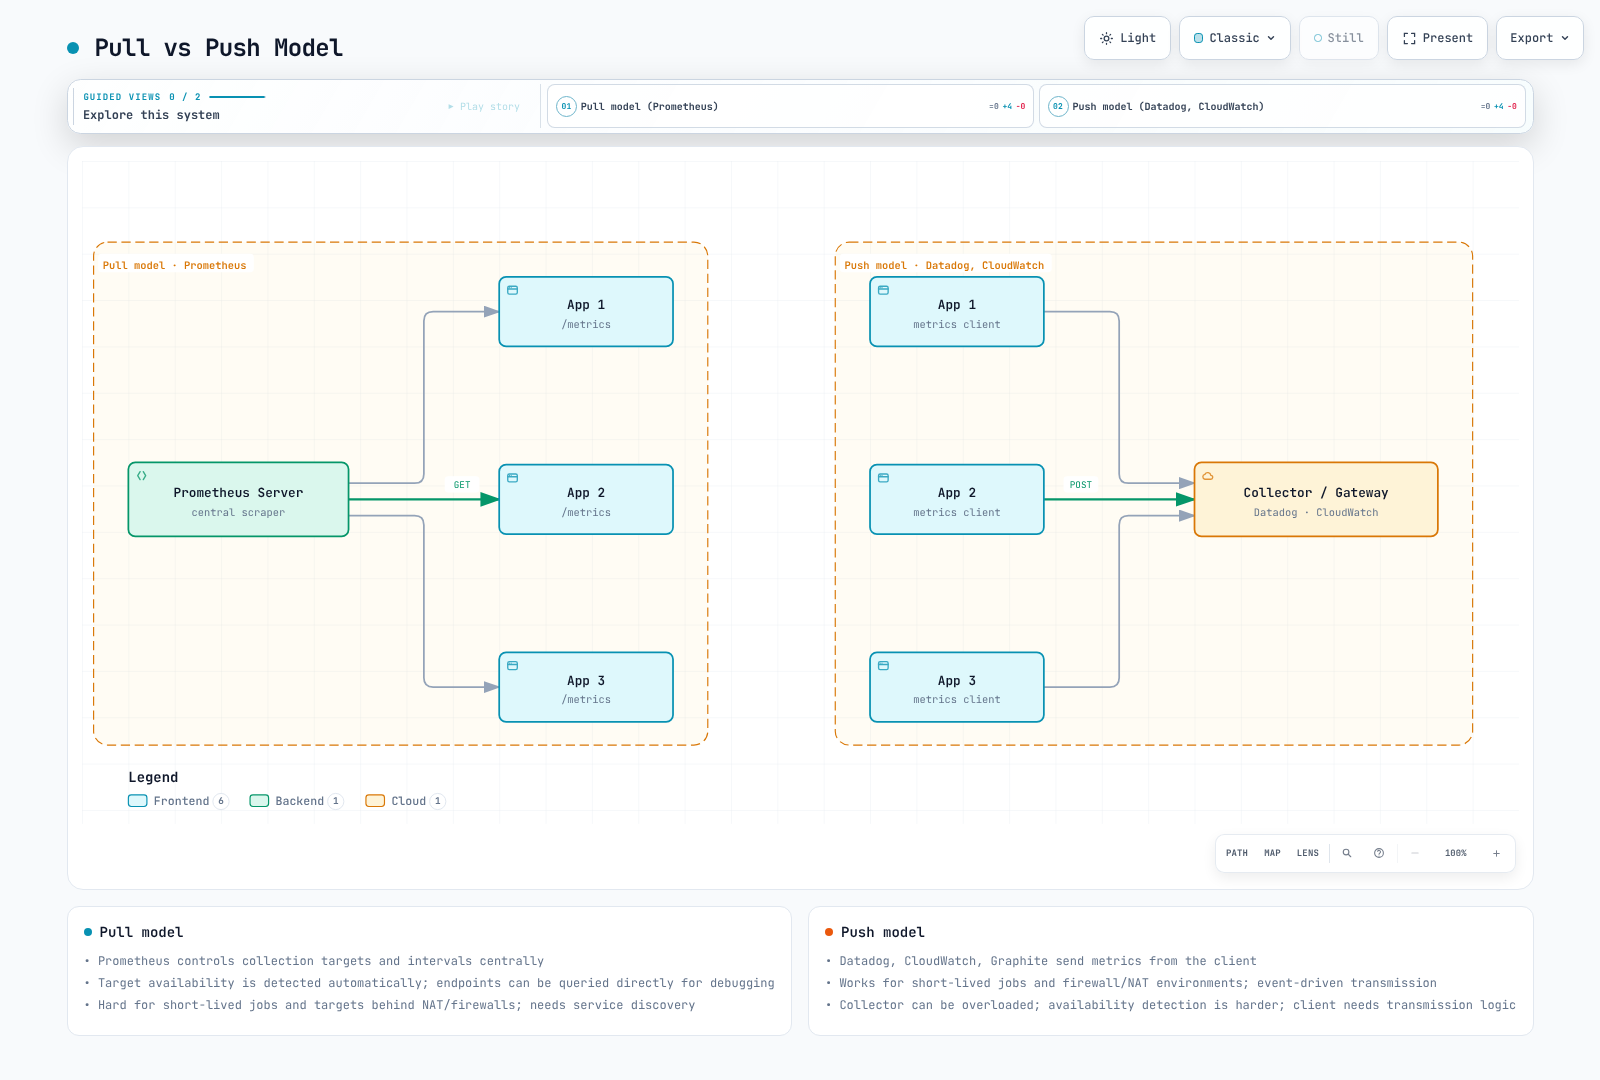
この図は接続方向を示しています。実際の pipeline では両方のモデルを混在させることができます。agent が endpoint を scrape し、その結果を forward することがあります。vendor 名は、すべての integration が 1 つのモデルを使用することを意味しません。
Pull と Kubernetes discovery
Pull 収集は target と interval を一元的に制御し、endpoint を簡単に検査できます。collector には outbound connectivity が、target には許可された inbound access が必要で、routing、TLS、authorization を設定する必要があります。NAT によって target が自動的に到達可能になるわけではありません。Prometheus の up は scrape 成功を報告するものであり、application の availability SLO ではありません。
この Prometheus 設定 fragment は、opt-in 済みで、名前付き TCP metrics container port を持つ example-app の Running Podを選択します。IPv4 専用の regular expression で書き換えるのではなく、discovered address を使用します。
# pod-scrape.yaml
scrape_configs:
- job_name: example-app
  kubernetes_sd_configs:
  - role: pod
    namespaces:
      names:
      - example-app
  relabel_configs:
  - source_labels:
    - __meta_kubernetes_pod_annotation_prometheus_io_scrape
    action: keep
    regex: 'true'
  - source_labels:
    - __meta_kubernetes_pod_phase
    action: keep
    regex: Running
  - source_labels:
    - __meta_kubernetes_pod_container_port_name
    action: keep
    regex: metrics
  - source_labels:
    - __meta_kubernetes_pod_container_port_protocol
    action: keep
    regex: TCP
  - source_labels:
    - __meta_kubernetes_pod_annotation_prometheus_io_path
    action: replace
    target_label: __metrics_path__
    regex: (.+)
  - source_labels:
    - __meta_kubernetes_namespace
    target_label: namespace
  - source_labels:
    - __meta_kubernetes_pod_name
    target_label: pod
前提条件: Pod annotation prometheus.io/scrape: "true"、metrics という名前で宣言された port、任意の prometheus.io/path、およびこれらの Pod を discover するための Prometheus Kubernetes API credentials/RBAC。この endpoint は実際にその port/path でメトリクスを提供する必要があります。これは設定 fragment であり、cluster installation や到達可能性の証明ではありません。
Push と service-level batch job
Push は、短命な workload を含む outbound access を持つ producer に適合する場合があります。それでも receiver capacity、authentication、timeout/retry 処理、欠落した producer を検出する方法が必要です。receiver health check の成功は、batch job が実行された証拠ではありません。
Prometheus は Pushgateway を、すべての短命な Pod のデフォルトではなく、限定されたservice-level batch use case に推奨しています。push された group は自動的に expire しません。放棄された group を残す Pod ごとの HOSTNAME grouping は避け、安定した job ownership と明示的な retirement/cleanup process を定義してください。
以下は、1 つの論理 batch に対する成功後の integration fragmentであり、実行可能な Kubernetes Job ではありません。到達可能で認可された Pushgateway、sh、awk、curl を前提としています。この batch は測定した duration、処理済み record 数、元の completion timestamp を提供します。delivery を retry する場合は、その元の timestamp を保持してください。例に secret を埋め込まず、環境に適した TLS/authentication を追加してください。
set -eu
: "${PUSHGATEWAY_URL:?Set the reachable authorized Pushgateway base URL}"
: "${DURATION_SECONDS:?Set the measured duration of the successful batch}"
: "${RECORDS_PROCESSED:?Set the number of records processed by that batch}"
: "${COMPLETED_AT_SECONDS:?Set its original Unix completion time in seconds}"

# Reject nonnumeric metric values before sending anything.
awk -v n="$DURATION_SECONDS" 'BEGIN { exit !(n ~ /^[0-9]+([.][0-9]+)?$/) }'
case "$RECORDS_PROCESSED" in *[!0-9]*|'') exit 2;; esac
case "$COMPLETED_AT_SECONDS" in *[!0-9]*|'') exit 2;; esac

cat <<EOF | curl --fail --silent --show-error --connect-timeout 5 --max-time 15 \
  --request PUT --data-binary @- "${PUSHGATEWAY_URL%/}/metrics/job/example_batch"
# TYPE example_batch_last_run_duration_seconds gauge
example_batch_last_run_duration_seconds ${DURATION_SECONDS}
# TYPE example_batch_last_run_records_processed gauge
example_batch_last_run_records_processed ${RECORDS_PROCESSED}
# TYPE example_batch_last_success_timestamp_seconds gauge
example_batch_last_success_timestamp_seconds ${COMPLETED_AT_SECONDS}
EOF
PUT はこの安定した grouping key のメトリクスを置き換えます。独立した job が同じ key を競合して使用してはなりません。失敗した作業の後に success timestamp を push したり、scrape される前に成功のたびに group を削除したりしないでください。論理 job を retirement する際は、その所有する group を意図的に削除してください。
push された job identity が保持されるよう、honor_labels で Pushgateway を scrape してください。
# pushgateway-scrape.yaml
scrape_configs:
- job_name: pushgateway
  honor_labels: true
  static_configs:
  - targets:
    - pushgateway:9091
最後に成功した completion からの経過時間(秒):
time() - max(example_batch_last_success_timestamp_seconds{job="example_batch"})schedule と想定 runtime に基づいて threshold を選び、series 全体が欠落している場合は別途処理してください。Pushgateway の up は gateway scrape だけを表します。
カーディナリティとメトリクス設計
カーディナリティは、定義された scope における個別 series の数です。label-value count の積は、すべての組み合わせが発生し得る場合の上限であり、すべての組み合わせが存在する保証ではありません。
5 つの method × 20 の正規化された route × 10 の status は、最大 1,000 の application label の組み合わせになります。target/replica label と classic histogram bucket、さらに sum/count は、この数を増加させる可能性があります。series churn も履歴 storage と index cost を追加します。
/users/{id} のような境界のある route template を使用してください。user ID、request ID、session ID、変化する timestamp を通常のメトリクス label として使用しないでください。これらは機密データを公開するリスクもあります。失われる詳細が許容できる場合にのみ status code を group 化してください。request 固有のコンテキストは、適切に制御された logs/traces に入れてください。
これらの scope を限定した query は、TSDB に保存されているすべての履歴 series ではなく、現在選択可能な series をカウントします。
topk(10, count by (__name__) ({job="example-app"}))count(http_requests_total{job="example-app"})count(count by (endpoint) (http_requests_total{job="example-app"}))メトリクス名と label 名/value の長さも、format limit、storage、backend acceptance に影響します。カーディナリティは重要ですが、唯一の設計制約ではありません。
長期保存の要件
Prometheus local TSDB は compression を使用し、適切に設定および provision された場合には 30 日よりもはるかに長くデータを保持できます。time/size retention 設定が指定されていない場合、デフォルトの time retention は 15 日です。これは上限ではありません。
local storage は replication された distributed store ではありません。独立した Prometheus replica は Thanos や Mimir を必要とせずに collection/alerting redundancy を提供できますが、shared querying、deduplication、remote durability、recovery には独自の設計が必要です。長期間 query の cost は、単に calendar age ではなく、data volume と expression に依存します。
Retention 計画
| ニーズ | 計画上の質問 |
|---|---|
| Alert evaluation | どの lookback window、outage buffer、missing-data behavior が必要か? |
| Incident analysis | 有用な解像度をどれくらいの期間利用可能にする必要があるか? |
| Capacity/seasonality | 数か月分または前年比較が必要か? |
| Audit obligations | この data、access、deletion に適用される実際の policy は何か? |
| Recovery | backup、restore test、独立した failure domain が必要か? |
普遍的な「メトリクスは 1~7 年保持しなければならない」というルールはありません。workload に対して retention と解像度、deletion/access policy、recovery objective を指定してください。
Remote write
この fragment は、すでにデプロイ済みの single-node VictoriaMetrics receiver を対象としています。review 済みの scrape configuration と統合してください。cluster receiver は異なる path/topology を使用します。tenant ID だけでは authentication になりません。環境に適した認可済みの TLS 保護された endpoint を使用してください。
# remote-write.yaml
global:
  scrape_interval: 15s
remote_write:
- url: http://victoriametrics:8428/api/v1/write
  queue_config:
    capacity: 10000
    max_samples_per_send: 2000
    max_shards: 10
  write_relabel_configs:
  - source_labels:
    - __name__
    regex: example_debug_payload_total
    action: drop
この例は、ドキュメントに記載された queue/batch のデフォルトである 10,000/2,000 を保持しています。max_shards: 10 は測定済みの最適値ではなく、例示的な concurrency cap です。queue memory は shard と capacity に応じて増加します。tuning guide は batch size の約 3~10 倍の capacity を推奨しています。デフォルトから開始し、backlog、throughput、memory を測定してください。
明示的な drop rule は、review 済みの 1 つの debug metric を remote delivery から除外する例であり、local sample を削除するものではありません。すべての go_.* メトリクスを drop することは一般的な cardinality 対策ではなく、runtime diagnostics を破棄します。
remote write は asynchronous であり、その WAL buffering には限りがあります。Prometheus tuning guide は、文書化された WAL window(そのガイダンスでは約 2 時間)を超える長時間の outage の後で、未送信 data が失われることを説明しています。これは backup ではなく、delivery が常に成功する保証でもありません。
ソリューション比較
デプロイと運用の境界
| 選択肢 | 評価対象 |
|---|---|
| Prometheus server | Local TSDB、PromQL、rules、retention/capacity、独立した replica、recovery |
| VictoriaMetrics | single-node と cluster deployment、MetricsQL/PromQL compatibility、storage capacity、tenant authorization、replication、edition 固有の機能 |
| Grafana Mimir | distributed service と object storage、local/ingest resource、replication、tenant authentication、limit、operational capacity |
| CloudWatch metrics | AWS 管理の metric storage、metric math/Metrics Insights、関連 integration、dimension、query product、quota、解像度 |
| Datadog metrics | SaaS と agent/integration、tag cardinality、product entitlement、query rollup、billing |
object storage は無制限の scaling を意味するものでも、すべての local-disk requirement を排除するものでもありません。VictoriaMetrics backup target と特定 edition の機能は、primary storage architecture と交換可能ではありません。「7×」のような compression benchmark claim には、名前を明記した dataset、version、method が必要です。ここではそのような主張は行いません。
traditional CloudWatch metrics では、解像度は経過時間に応じて変わります。sub-minute point は 3 時間、one-minute point は 15 日、five-minute point は 63 日、hourly point は 455 日利用可能です。他の metric product/ingestion path は別途確認する必要があります。Datadog が公開する retention table では metric tag/value は 15 か月とされていますが、query には rollup が適用されます。これはすべての graph で元の scrape 解像度を保証するものではありません。
サポートされない月額合計ではなくコスト入力を使用する
100 万が実際に export された series 数である場合、均一な 15 秒 interval で 30 日間では、delivery filtering/deduplication 前に 1,000,000 × 30 × 86,400 / 15 = 172,800,000,000 sample になります。100 万が application label の組み合わせのみを指す場合、まず target、replica、histogram series を拡張してください。
| 選択肢 | 見積もりに必要な入力 |
|---|---|
| Self-managed storage | CPU/RAM、sample あたりの測定済み byte、index/WAL/headroom、replica、storage/network、backup、operator time |
| Amazon Managed Service for Prometheus | ingest された sample、storage、query processing、選択した collection feature、region price |
| CloudWatch | 請求対象の metric/dimension 組み合わせ、解像度、API/query、選択した observability feature |
| Datadog | 選択した plan、host/container、含まれるおよび追加の custom metric、tag、その他の有効な product |
同等の ingestion、retention、HA、feature の前提条件を比較してください。以下の公式 pricing page から最新価格を取得し、workload 固有の resource use をテストしてください。「Open source」であっても infrastructure と operation は無料ではありません。
必要な query/解像度、cardinality と churn、failure/recovery goal、tenant/access boundary、integration、測定済みの cost model に基づいてソリューションを選択してください。team size だけで product を選択するアルゴリズムにはなりません。
メトリクス収集アーキテクチャ
collection、storage/query、rule evaluation、notification の責務を分離してください。
| コンポーネント | 役割 |
|---|---|
| node-exporter | memory、filesystem、network counter などの Host OS メトリクス |
| kube-state-metrics | Kubernetes API object の状態。container CPU measurement の代替ではない |
| kubelet/cAdvisor endpoint | container resource measurement。endpoint availability と scrape authorization には検証が必要 |
| metrics-server | autoscaling と kubectl top 向けの Resource Metrics API。履歴 Prometheus TSDB ではない |
| Prometheus | scrape、local storage/query、rule evaluation |
| vmagent | buffering 付きでメトリクスを収集・forward する。query 可能な Prometheus TSDB ではない |
| VictoriaMetrics / Mimir | それぞれの deployment architecture に応じてメトリクスを保存・query する |
| Prometheus rules / vmalert / Mimir ruler | expression を評価し、alert を Alertmanager に送信する |
| Alertmanager | alert を group、route、inhibit、delivery する。PromQL 評価のために TSDB を query するものではない |
| Grafana | 設定済み data source を query し、結果を可視化する |
各接続に対して discovery、RBAC、credentials、TLS、network access を計画してください。より多くの endpoint を scrape することは、どの signal が workload の質問に答えるかを定義する代わりにはなりません。
主な参考資料
- Prometheus メトリクスの種類、histogram と summary、exposition format
- Prometheus 3.14 設定 と storage
- Pushgateway を使用する場合、Pushgateway lifecycle/API、remote-write tuning
- VictoriaMetrics cluster、vmagent、Mimir architecture
- CloudWatch metric retention、Datadog retention、Datadog rollup
- 公式 pricing: Amazon Managed Service for Prometheus、CloudWatch、Datadog