Kubernetes/EKS トラブルシューティング・プレイブック: 症状 → 診断 → 原因 → 修正
サポート対象バージョン: Kubernetes 1.33+(Amazon EKS 1.36 で出力を検証 — control plane v1.36.2-eks-bca9cf6、platform version eks.9)、Karpenter 1.4、VPC CNI v1.21、CoreDNS v1.14 最終更新: September 2, 2026
< 前へ: Zonal Cluster Operations | 目次 >
午前3時にページャーが鳴り、ターミナルを開いたときに必要なのは概念の説明ではなく、「今見えている状況で次に入力するコマンド」です。このドキュメントは概念ではなく症状から始めます。各症状について、「見えているもの → 実行するもの → 出力の見え方 → 最も一般的な原因と修正方法」を1つのブロックにまとめています。
ここに示すイベントメッセージと出力例は、2026年9月2日に、このリポジトリの検証用 EKS cluster(EKS 1.36 — control plane v1.36.2-eks-bca9cf6、platform version eks.9 — Karpenter 1.4.0、VPC CNI v1.21.1、CoreDNS v1.14.2)に対する kubectl get/describe/events で取得したもの、または References に挙げた公式 Kubernetes/AWS documentation から引用した文字列です。リソース名だけは一般化しています。
詳細な root-cause analysis(control plane logs、CloudWatch Logs Insights queries、node join failure の8つの原因など)は、すでに EKS Troubleshooting と EKS Advanced Debugging にあります。このページはそれらの前段に位置します。その役割は、30秒以内に開くべきページを決めることなので、内容を繰り返すのではなくリンクします。
目次
30秒サマリー: 症状 → 最初のコマンド → 最も一般的な原因
各症状セルは、以下の対応するプレイブック節へリンクしています。
症状(kubectl get pods/nodes の表示) | 最初のコマンド | 最も一般的な原因 |
|---|---|---|
Pending (English) | kubectl describe pod <pod> → Events の FailedScheduling メッセージ | リソース不足(Insufficient cpu/memory)、toleration 不足、nodeSelector 不一致、未バインドの PVC |
ImagePullBackOff / ErrImagePull | kubectl describe pod <pod> → Failed to pull image 行 | tag のタイプミス、private registry 認証(imagePullSecrets/node IAM)、ECR region/account 不一致 |
CrashLoopBackOff (English) | kubectl logs <pod> --previous + lastState.terminated を確認 | 起動時の app 失敗(exit 1)、OOMKilled(exit 137)、liveness probe 失敗、ConfigMap/Secret 不足 |
Running だが READY 0/1 (English) | kubectl describe pod <pod> → Readiness probe failed | 誤った readiness path/port、依存先待ち、sidecar が Ready でない |
| リクエストが Service に到達しない (English) | kubectl get endpointslices -l kubernetes.io/service-name=<svc> | selector label 不一致、誤った targetPort、NetworkPolicy block、CoreDNS 障害 |
Node NotReady (English) | kubectl describe node <node> → Conditions | kubelet 停止/network partition、DiskPressure、MemoryPressure、PIDPressure |
PVC Pending (English) | kubectl describe pvc <pvc> → Events | WaitForFirstConsumer(正常な待機)、StorageClass の欠落/スペルミス、AZ 不一致 |
app logs の AccessDenied(AWS API) (English) | kubectl get sa <sa> -o yaml + pod の env | grep AWS | IRSA(IAM Roles for Service Accounts)の annotation/trust policy エラー、Pod Identity association 不足、pods が再起動されていない |
ContainerCreating で停止 + failed to assign an IP address (English) | kubectl describe pod <pod> → FailedCreatePodSandBox | Subnet IP 枯渇、node max-pods 到達、aws-node が不健全 |
| Karpenter が node を起動しない (English) | kubectl get events -A --field-selector reason=FailedScheduling | NodePool limits 到達、requirements/taint 不一致、instance type 制限 |
Service 作成が failed calling webhook で拒否される (English) | kubectl -n kube-system get endpointslices -l kubernetes.io/service-name=aws-load-balancer-webhook-service | すべての namespace に一致する failurePolicy: Fail webhook の背後にある Webhook Deployment が不健全(CrashLoop) |
診断判断ツリー
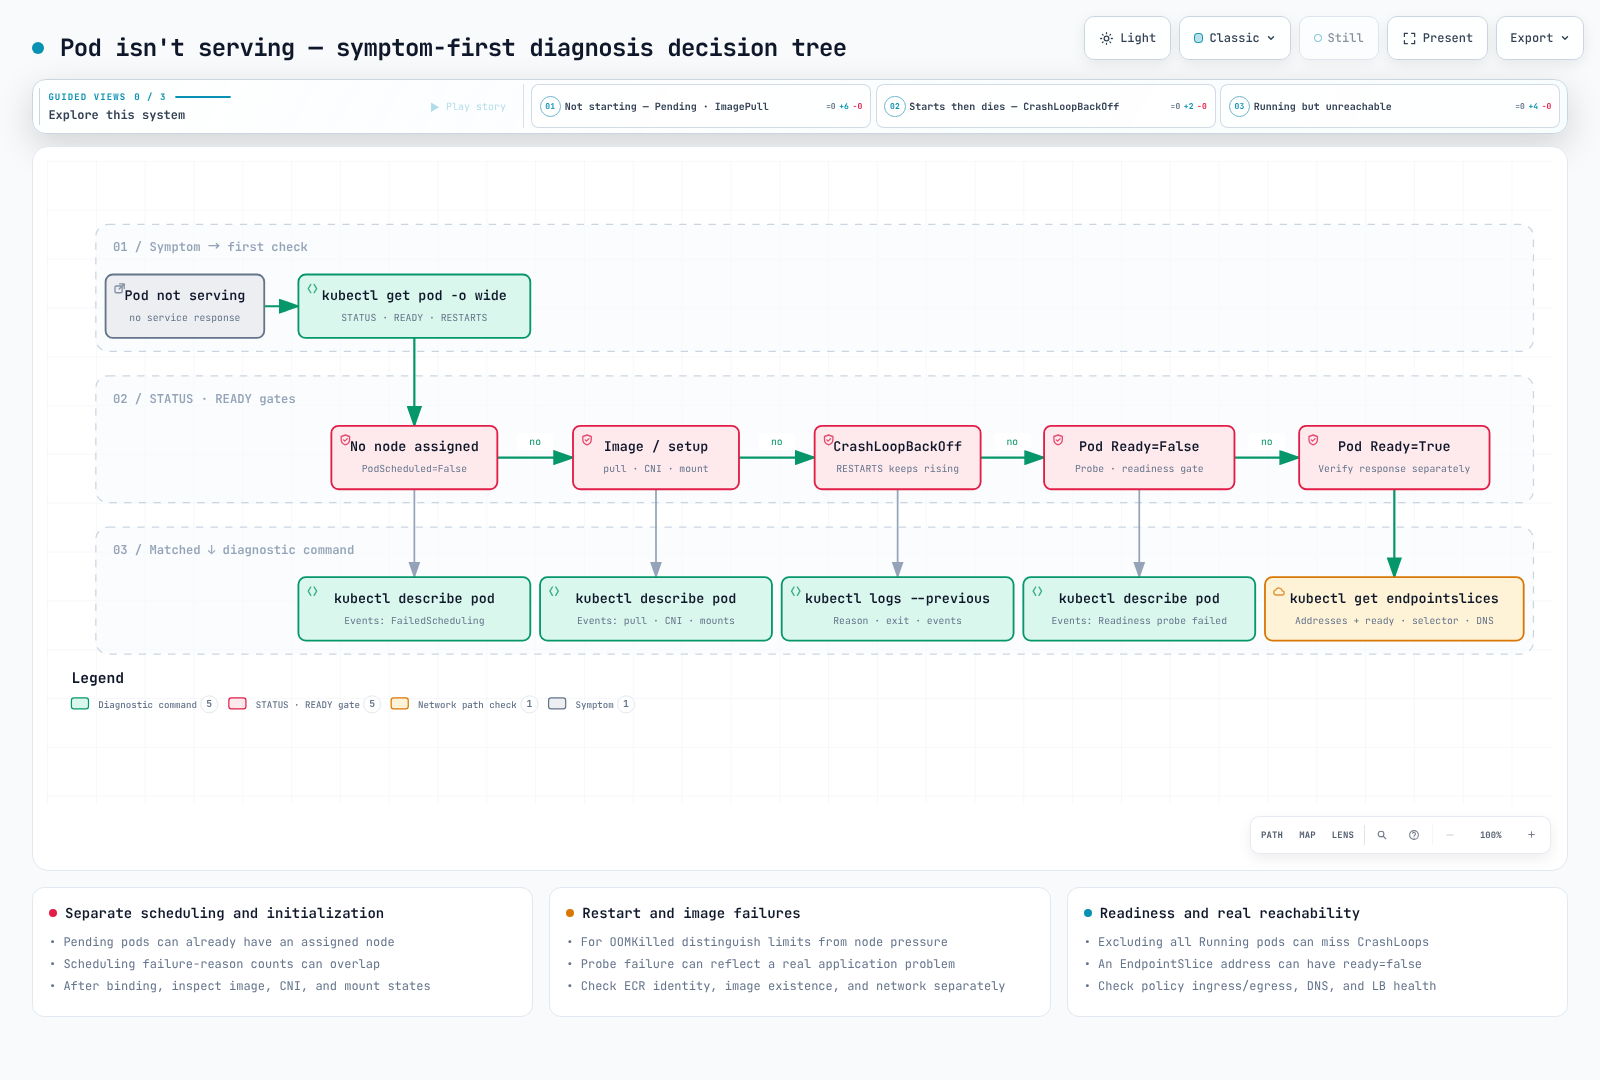
ツリーの入口は常に同じです。すべての namespace で不健全な pods に絞り込み、Warning events を時系列順に読みます。
# Pods that are neither Running nor Succeeded
kubectl get pods -A --field-selector=status.phase!=Running,status.phase!=Succeeded

# Recent Warning events (cluster-wide, chronological)
kubectl get events -A --field-selector type=Warning --sort-by=.lastTimestamp | tail -30
症状別プレイブック
1. Pending で停止した Pod
症状: kubectl get pods の STATUS が Pending、READY が 0/1 です。node はまだ割り当てられていないため、kubectl logs には何も表示されません。
診断: 答えは常に describe の最後の FailedScheduling event にあります。scheduler は、各 node が拒否された理由を node ごとに集約します。
kubectl describe pod <pod> -n <ns> | sed -n '/^Events:/,$p'Warning FailedScheduling default-scheduler 0/15 nodes are available: 1 Insufficient cpu, 1 Insufficient memory,
6 node(s) didn't match Pod's node affinity/selector, 8 node(s) had untolerated taint(s).
no new claims to deallocate, preemption: 0/15 nodes are available:
1 No preemption victims found for incoming pod, 14 Preemption is not helpful for scheduling.読み方: 15 nodes のうち、8 は taints、6 は nodeSelector/affinity により拒否され、残りの1 node は CPU と memory が不足しています。つまり、この pod の対象となる node は1つだけで、その node は満杯です。no new claims to deallocate は DRA(Dynamic Resource Allocation)plugin が追加するものです。ResourceClaims を使用しない pods では無視してください。
原因と修正:
| メッセージ断片 | 原因 | 修正 |
|---|---|---|
Insufficient cpu / Insufficient memory | requests が残り node capacity を超過 | requests を適正化し、autoscaler を確認(→ 10. Karpenter (English))、kubectl describe node の Allocated resources を確認 |
Too many pods | node max-pods 到達(VPC CNI ENI limit) | → 9. ENI/IP 枯渇 (English) |
node(s) had untolerated taint(s) | node taints に対応する toleration がない | kubectl get nodes -o custom-columns=NAME:.metadata.name,TAINTS:.spec.taints[*].key で taints を列挙し、toleration を追加するか NodePool を調整 |
node(s) didn't match Pod's node affinity/selector | nodeSelector/affinity label を持つ node がない | kubectl get nodes --show-labels を確認。Karpenter では key を NodePool requirements に含めないと node は作成されません |
pod has unbound immediate PersistentVolumeClaims | PVC が Pending | → 7. PVC Pending (English) |
node(s) had volume node affinity conflict | PV(EBS)が存在する AZ に schedulable node がない | PV の nodeAffinity zone を確認し、その AZ に capacity を用意 |
node(s) didn't match pod topology spread constraints / pod anti-affinity rules | spread constraint を満たす node がない | whenUnsatisfiable: ScheduleAnyway で緩和するか nodes を追加 |
| events がまったくない | scheduler の問題、または schedulerName のスペルミス | kubectl get pod <pod> -o jsonpath='{.spec.schedulerName}' を確認 |
2. ImagePullBackOff / ErrImagePull
症状: STATUS は ErrImagePull で始まり、数回の retry 後に ImagePullBackOff になります。kubelet の pull back-off は最大5分まで増加します。
診断:
kubectl describe pod <pod> -n <ns> | grep -A2 -E "Failed to pull|Back-off pulling"
kubectl get pod <pod> -n <ns> -o jsonpath='{range .spec.containers[*]}{.name}{"\t"}{.image}{"\n"}{end}'
kubectl get pod <pod> -n <ns> -o jsonpath='{.spec.imagePullSecrets}'
Warning Failed kubelet Failed to pull image "123456789012.dkr.ecr.ap-northeast-2.amazonaws.com/app:v1.2.3": ... not found
Warning Failed kubelet Error: ErrImagePull
Normal BackOff kubelet Back-off pulling image "123456789012.dkr.ecr.ap-northeast-2.amazonaws.com/app:v1.2.3"
Warning Failed kubelet Error: ImagePullBackOff正常な pull では Pulling image "..." → Successfully pulled image "..." in 4.501s ... の組が残り、すでに cache 済みの image では Container image "..." already present on machine と記録されます。これらの正常イベントがあるのに pod が起動しなければ、image は問題ではありません。
原因と修正:
Failed to pull image の後に続くもの | 原因 | 修正 |
|---|---|---|
not found / manifest unknown | tag のタイプミス、tag が未 push、誤った repository | aws ecr describe-images --repository-name <repo> --image-ids imageTag=<tag> で確認 |
401 Unauthorized / no basic auth credentials | private registry 認証失敗 | ECR では node IAM role に AmazonEC2ContainerRegistryPullOnly(または ReadOnly)が必要。外部 registry では imagePullSecrets を確認 |
| ECR URL の region/account が cluster と異なる | cross-account pull permission がない | ECR repository policy に pulling principal を追加 |
dial tcp ... i/o timeout | NAT/VPC endpoints のない private subnet | com.amazonaws.<region>.ecr.api、ecr.dkr、S3 gateway endpoint を確認 |
toomanyrequests | Docker Hub rate limit | ECR pull-through cache 経由で mirror |
node 自身から再現するには、kubectl debug node/<node> -it --image=busybox --profile=sysadmin の後、chroot /host crictl pull <image> を実行します。kubelet と同じ path で pull されます(--profile=sysadmin は debug container に crictl が必要とする privileges を与えます。→ チートシート)。
3. CrashLoopBackOff(exit 137 OOMKilled、probe failures、config errors)
症状: STATUS が CrashLoopBackOff で、RESTARTS が増え続けます。restart delay は10秒から始まり最大5分まで倍増するため、pod はしばらく Running に見えた後、再び終了します。
診断: 次の3点を順に確認します。termination reason と exit code、直前の container の logs、Eventsです。
# (1) Why did it die: lastState.terminated
kubectl get pod <pod> -n <ns> -o jsonpath='{range .status.containerStatuses[*]}{.name}{"\t"}restarts={.restartCount}{"\t"}reason={.lastState.terminated.reason}{"\t"}exit={.lastState.terminated.exitCode}{"\n"}{end}'

# (2) Logs right before death (the previous container, not the current one)
kubectl logs <pod> -n <ns> -c <container> --previous --tail=100

# (3) Probe/kill events
kubectl describe pod <pod> -n <ns> | sed -n '/^Events:/,$p'
実際の出力 — memory limit が 128Mi の container が OOM で kill された例:
    Last State:     Terminated
      Reason:       OOMKilled
      Exit Code:    137
      Started:      Mon, 31 Aug 2026 08:55:27 +0000
      Finished:     Tue, 01 Sep 2026 21:13:37 +0000
    Restart Count:  3
Started と Finished を比較してください。この container は kill まで約36時間動作しており、起動時の問題ではなく、ゆっくりした memory leak または徐々に増える working-setを示します。起動時の crash loop は異なります。Finished は Started の数秒後になり、RESTARTS は数分で増加します。
exit codes の読み方:
| Exit Code | Reason | 意味 | 修正 |
|---|---|---|---|
0 | Completed | process は正常終了 — Deployment では app が foreground で維持されていないことを意味する | entrypoint を daemon/foreground mode で実行するか、Job に変更 |
1 | Error | app 自身が終了(config error、dependency connection failure) | stack trace は logs --previous にある |
126 | Error | shell entrypoint で command は見つかったが実行不可 — execute bit 不足、または shell が cannot execute binary file: Exec format error(architecture mismatch)を報告 | Dockerfile で chmod +x。kubectl get nodes -L kubernetes.io/arch で arm64/amd64 を確認し multi-arch image を使用 |
127 | Error | shell entrypoint で command が見つからない — path のタイプミス、または binary が最終 image stage に copy されていない | command/args を image 内の実体(kubectl debug ... -- ls <path>)と比較 |
137 | OOMKilled | memory limit 超過後の kernel SIGKILL | limit を上げるか leak を修正。JVM は -XX:MaxRAMPercentage を確認 → Resource Optimization |
137 | Error | 別の理由による SIGKILL — liveness 失敗後、container が terminationGracePeriodSeconds 内に終了しなかった | preStop/graceful shutdown を確認 |
143 | Error | SIGTERM で終了(通常の rollout/eviction の場合もある) | 繰り返す場合、Events で kill している主体を確認 |
- image が binary を直接 exec する場合(間に shell がない場合)、architecture mismatch は exit 126 をまったく生成しません。container は起動せず、
lastState.terminatedの Reason はStartError、message にexec format errorが表示されます。修正は同じです。multi-arch image、またはkubernetes.io/archの nodeSelector を使用します。
Probe failures: Events にこの2行が組で表示される場合、問題は application code ではなく probe configuration であることが多いです。
Warning  Unhealthy  kubelet  Liveness probe failed: HTTP probe failed with statuscode: 503
Normal Killing kubelet Container app failed liveness probe, will be restarted- app の起動が遅い場合は、liveness の
initialDelaySecondsを増やす代わりにstartupProbeを追加します(startup probe が成功するまで liveness は開始されません)。 Readiness probe failed: dial tcp 10.0.2.45:8080: connect: connection refusedのような TCP refusal がある場合、まず container port と probe port が異ならないかを確認してください。
Configuration reference errors — 厳密には crash loop ではありません。pod は CreateContainerConfigError で停止します:
Warning  Failed  kubelet  Error: configmap "app-config" not found
Warning  Failed  kubelet  Error: secret "db-credentials" not found
kubectl get cm,secret -n <ns> で names と namespaces を比較すれば完了です。reference が volume mount の場合は、代わりに FailedMount event(MountVolume.SetUp failed for volume "cfg" : configmap "app-config" not found)として表示されます。
4. Running だが Ready でない / Endpoints が空
症状: STATUS は Running ですが READY は 0/1(sidecar がある場合は 1/2)です。Service はこの pod に traffic を送らないため、ユーザー側からは「deployed されたが 503」です。
診断:
kubectl describe pod <pod> -n <ns> | grep -E "Ready|Readiness probe"
kubectl get endpointslices -n <ns> -l kubernetes.io/service-name=<svc>
背後に Ready pod がない Service — つまり探している症状 — は ENDPOINTS column に <unset> を表示します(PORTS も同様です。EndpointSlice controller は運ぶ endpoint がない場合に port list を削除します)。この cluster で、selector が動作中の pod に一致しない Service から取得した出力です:
NAME            ADDRESSTYPE   PORTS     ENDPOINTS   AGE
api-svc-xd28r   IPv4          <unset>   <unset>     145d
対照として、正常な Service(同じ cluster の kube-dns)は Ready pod ごとに1 IP を表示します:
NAME             ADDRESSTYPE   PORTS        ENDPOINTS              AGE
kube-dns-xc4bb IPv4 53,53,9153 10.0.2.106,10.0.3.14 145d<unset>(または空の)ENDPOINTS column は、Service の背後に Ready pod がないことを意味します。Kubernetes 1.33+ では kubectl get endpoints は Warning: v1 Endpoints is deprecated in v1.33+; use discovery.k8s.io/v1 EndpointSlice と表示するため、EndpointSlices の読み方に慣れてください。
原因と修正:
| 観測結果 | 原因 | 修正 |
|---|---|---|
Events に Readiness probe failed が繰り返し出る | probe path/port が誤っている、または app が dependency(DB など)をまだ待っている | probe を app の実際の health endpoint に向ける。dependency wait は liveness ではなく readiness に置く |
reason ReadinessGatesNotReady で Condition Ready False | pod readiness gate を待機 — 通常は AWS Load Balancer Controller の target-health.elbv2.k8s.aws/* gate | Target Group health check が失敗する理由を調べる → AWS Load Balancer Controller |
1/2 Running で app container だけが Ready | sidecar(istio-proxy など)が Ready でない、または sidecar が app の後で起動し初期 connection が失敗 | sidecar logs を確認。sidecar を native sidecar(initContainers + restartPolicy: Always)に変更 |
| Ready なのに EndpointSlice が空 | Service selector が pod labels と一致しない | → 5. Service unreachable (English) |
5. Service に到達できない
症状: すべての pod が 1/1 Running であるにもかかわらず、curl http://<svc>.<ns>.svc.cluster.local が timeout/refuse する、または name resolution が失敗します。
診断を3層に分割します: (a) Service → pod mapping、(b) network policy、(c) DNS。
# (a) Compare the selector with actual labels
kubectl get svc <svc> -n <ns> -o jsonpath='{.spec.selector}{"\n"}{.spec.ports}{"\n"}'
kubectl get pods -n <ns> -l <key>=<value> -o wide
kubectl get endpointslices -n <ns> -l kubernetes.io/service-name=<svc>

# (b) NetworkPolicies applied to the namespace
kubectl get networkpolicies -n <ns>
kubectl describe networkpolicy <policy> -n <ns>

# (c) CoreDNS status and logs
kubectl get pods -n kube-system -l k8s-app=kube-dns
kubectl logs -n kube-system -l k8s-app=kube-dns --tail=50
kubectl get cm -n kube-system coredns -o jsonpath='{.data.Corefile}'原因と修正:
| 観測結果 | 原因 | 修正 |
|---|---|---|
selector は {"app":"api"} だが pods は app=api-server label | label 不一致 → EndpointSlice が空 | labels/selector を統一。Helm charts では selectorLabels と podLabels の乖離がよくある原因 |
EndpointSlice に IPs はあるが connection refused | targetPort が container が実際に listen する port と異なる | kubectl get pod -o jsonpath='{.spec.containers[*].ports}' と比較。app が 127.0.0.1 のみに bind する場合も同じ症状 |
| 特定の namespace からのみ失敗 | default-deny NetworkPolicy が存在し ingress allow rule がない | podSelector/namespaceSelector を確認。VPC CNI network policy では kubectl get policyendpoints -n <ns> に実際の enforcement が表示 → Network Policies |
nslookup <svc> が NXDOMAIN を返す | 別 namespace から short name を使用、または CoreDNS 障害 | FQDN(<svc>.<ns>.svc.cluster.local)を使用。CoreDNS pods が Running、/etc/resolv.conf の nameserver が kube-dns ClusterIP(この cluster では 172.20.0.10)であることを確認 |
| 外部 domain resolution が遅い | default の ndots:5 では、5 dots 未満の name は absolute name として query される前に各 search domain(<ns>.svc.cluster.local、svc.cluster.local、cluster.local、node の VPC domain)で試行される | 外部 names の末尾に . を付けるか、dnsConfig.options で ndots: 2 を設定 |
| NodePort/LB が一部 nodes 経由でのみ動作 | その node に pod がない externalTrafficPolicy: Local | 想定された動作。すべての nodes で受け付けるには Cluster に変更 |
pod 視点で DNS を再現するには、使い捨て pod を起動します: kubectl run -it --rm dns-test --image=busybox:1.36 --restart=Never -- nslookup kubernetes.default.svc.cluster.local。CoreDNS concepts と Corefile は Services and Networking で扱っています。
6. Node NotReady / kubelet pressure(DiskPressure、MemoryPressure、PIDPressure)
症状: kubectl get nodes が NotReady を表示する、または node は Ready だが pods が Evicted になる、もしくは新しい pods が node(s) had untolerated taint(s) で回避します。
診断:
# One-line summary of node conditions
kubectl get nodes -o custom-columns='NAME:.metadata.name,READY:.status.conditions[?(@.type=="Ready")].status,MEM:.status.conditions[?(@.type=="MemoryPressure")].status,DISK:.status.conditions[?(@.type=="DiskPressure")].status,PID:.status.conditions[?(@.type=="PIDPressure")].status'

# Conditions with their reason
kubectl get node <node> -o jsonpath='{range .status.conditions[*]}{.type}{"="}{.status}{" ("}{.reason}{")\n"}{end}'

# Taints the node picked up automatically
kubectl get node <node> -o jsonpath='{.spec.taints}'
正常 node の出力(EKS Node Monitoring Agent がインストールされている場合、ContainerRuntimeReady/NetworkingReady/KernelReady/StorageReady conditions も表示されます):
MemoryPressure=False (KubeletHasSufficientMemory)
DiskPressure=False (KubeletHasNoDiskPressure)
PIDPressure=False (KubeletHasSufficientPID)
Ready=True (KubeletReady)
ContainerRuntimeReady=True (ContainerRuntimeIsReady)
NetworkingReady=True (NetworkingIsReady)
KernelReady=True (KernelIsReady)
StorageReady=True (DiskIsReady)原因と修正:
| Condition / reason | 自動 taint | 原因 | 修正 |
|---|---|---|---|
Ready=Unknown(NodeStatusUnknown、"Kubelet stopped posting node status.") | node.kubernetes.io/unreachable | kubelet process の停止、instance 停止/network partition、API server auth failure | EC2 instance state → SSM/kubectl debug node と journalctl -u kubelet を確認 |
Ready=False | node.kubernetes.io/not-ready | Container runtime 停止、CNI 未初期化(aws-node が不健全) | その node の aws-node は kubectl get pods -n kube-system -l k8s-app=aws-node -o wide で確認 |
DiskPressure=True(KubeletHasDiskPressure) | node.kubernetes.io/disk-pressure | image cache/container logs が root volume を占有 | crictl rmi --prune、log rotation、root EBS を拡張。pods は The node was low on resource: ephemeral-storage で Evicted される |
MemoryPressure=True(KubeletHasInsufficientMemory) | node.kubernetes.io/memory-pressure | requests なしで大きい limits の pods が集中、system reservation 不足 | requests を強制(LimitRange)、kube-reserved/system-reserved を確認 |
PIDPressure=True(KubeletHasInsufficientPID) | node.kubernetes.io/pid-pressure | fork storm(thread leak) | 問題の pod を特定して restart、podPidsLimit を設定 |
node 内を確認する必要があるときは、SSH ではなく以下を使用します:
kubectl debug node/<node> -it --image=busybox --profile=sysadmin -- chroot /host
# once inside
journalctl -u kubelet --since "10 min ago" | tail -50
df -h /var/lib/containerd
crictl ps -a | head
kubectl get nodes に一度も表示されない node(join failure: IAM role/access entry、subnet routing、security group、AMI mismatch)は別のトピックです → EKS Advanced Debugging — Node Join Failure Diagnosis、EKS Troubleshooting — Node and Pod Issues。Karpenter nodes では、まず section 10 (English) の NodeClaim check から始めます。
7. Pending で停止した PVC
症状: kubectl get pvc が Pending を表示し、それを使用する pod も pod has unbound immediate PersistentVolumeClaims で Pending です。
診断:
kubectl get pvc -n <ns>
kubectl describe pvc <pvc> -n <ns> | sed -n '/^Events:/,$p'
kubectl get storageclass
kubectl get pods -n kube-system -l app=ebs-csi-node -o wide     # is the CSI node plugin on that node?
NAME PROVISIONER RECLAIMPOLICY VOLUMEBINDINGMODE ALLOWVOLUMEEXPANSION AGE
gp2 kubernetes.io/aws-ebs Delete WaitForFirstConsumer false 145d
gp3 ebs.csi.aws.com Delete WaitForFirstConsumer true 76d原因と修正: describe pvc の Events message が診断です。
| Events message | 原因 | 修正 |
|---|---|---|
WaitForFirstConsumer: waiting for first consumer to be created before binding | 正常。 volumeBindingMode: WaitForFirstConsumer は pod が schedule されるまで volume creation を遅延させる | まだ使用する pod がないため Pending なら放置。pod も Pending なら pod の FailedScheduling を読む |
FailedBinding: no persistent volumes available for this claim and no storage class is set | storageClassName も default StorageClass もない | PVC に storageClassName: gp3 を設定するか、SC に storageclass.kubernetes.io/is-default-class: "true" を annotation |
ProvisioningFailed: storageclass.storage.k8s.io "<name>" not found | StorageClass のスペルミス、別 cluster から manifest を copy | kubectl get sc の実際の name を使用 |
ProvisioningFailed: error generating accessibility requirements: no topology key found for node <node> | EBS CSI node plugin が pod 配置 node に登録されていない(CSINode に driver がない) | kubectl get csinode <node> の DRIVERS column を確認。ebs-csi-node DaemonSet がその node で実行中か確認 |
ProvisioningFailed + UnauthorizedOperation/AccessDenied | EBS CSI controller の IRSA/Pod Identity に permission がない | → 8. IRSA/Pod Identity (English) — subject は ebs-csi-controller-sa |
Pod-side node(s) had volume node affinity conflict | 既存 PV(EBS)が AZ ap-northeast-2a にあり、schedulable nodes は別 AZ | EBS は AZ をまたげません。kubectl get pv <pv> -o jsonpath='{.spec.nodeAffinity}' で zone を読み、そこで capacity を用意(NodePool zone requirement または nodeSelector) |
Pod-side FailedAttachVolume: Multi-Attach error for volume | RWO volume が前の node にまだ attach されている(node failure 後に StatefulSet が reschedule) | kubectl get volumeattachments で stale attachments を確認。node が失われた場合、cleanup を数分待つ |
WaitForFirstConsumer、StorageClass、dynamic provisioning concepts は Storage に、EBS/EFS CSI error patterns は EKS Advanced Debugging — Storage Troubleshooting にあります。
8. EKS: IRSA / Pod Identity AccessDenied
症状: pod は問題なく Running ですが、app logs に AWS SDK error が出ます。
An error occurred (AccessDenied) when calling the AssumeRoleWithWebIdentity operation:
  Not authorized to perform sts:AssumeRoleWithWebIdentity
または S3/DynamoDB call 自体が ... is not authorized to perform: s3:GetObject で拒否され、拒否された principal が service account role ではなく node IAM role(assumed-role/<node-role>/i-0abc...)です。後者は credential injection が起きず、SDK が node role に fallback したことを意味します。
診断 — まずどの mechanism が使われているかを特定します。pod の environment variables が示します。
# Service account annotation (IRSA)
kubectl get sa <sa> -n <ns> -o jsonpath='{.metadata.annotations.eks\.amazonaws\.com/role-arn}{"\n"}'

# Credential-related env injected into the pod
kubectl get pod <pod> -n <ns> -o jsonpath='{range .spec.containers[0].env[*]}{.name}={.value}{"\n"}{end}' | grep ^AWS_| Injected env | Mechanism | 意味 |
|---|---|---|
AWS_ROLE_ARN=arn:aws:iam::...:role/<role> + AWS_WEB_IDENTITY_TOKEN_FILE=/var/run/secrets/eks.amazonaws.com/serviceaccount/token | IRSA | pod-identity-webhook により inject。なければ SA annotation が pod 作成後に追加されたか、SA name が異なる |
AWS_CONTAINER_CREDENTIALS_FULL_URI + AWS_CONTAINER_AUTHORIZATION_TOKEN_FILE | EKS Pod Identity | eks-pod-identity-agent が 169.254.170.23 で credentials を提供。association がある場合のみ inject |
| どちらもない | None → node role fallback | 以下の table を参照 |
# Pod Identity: agent and association
kubectl get pods -n kube-system -l app.kubernetes.io/name=eks-pod-identity-agent
aws eks list-pod-identity-associations --cluster-name <cluster> --namespace <ns> --service-account <sa>

# IRSA: OIDC condition in the trust policy
aws eks describe-cluster --name <cluster> --query 'cluster.identity.oidc.issuer' --output text
aws iam get-role --role-name <role> --query 'Role.AssumeRolePolicyDocument'原因と修正:
| 観測結果 | 原因 | 修正 |
|---|---|---|
| env がないが SA annotation はある | annotation 前に pod が作成された(webhook は作成時にのみ inject) | kubectl rollout restart deploy/<name> |
| env も association もない | Pod Identity association が作成されていない、または別の SA/namespace 用に作成 | aws eks create-pod-identity-association ...、その後 pods を restart |
Not authorized to perform sts:AssumeRoleWithWebIdentity | IRSA trust policy: Federated OIDC provider ARN が誤っている、または sub(system:serviceaccount:<ns>:<sa>)/aud(sts.amazonaws.com)condition が不一致 | trust policy を修正。cluster を再作成した場合 OIDC issuer が変わるため、provider も再作成が必要 |
Pod Identity だが AssumeRole が拒否 | trust policy principal が pods.eks.amazonaws.com ではない、または sts:TagSession がない | trust policy で sts:AssumeRole と sts:TagSession の両方を許可 |
env は正常で特定 API のみ AccessDenied | role の permission policy が不足(trust policy ではない) | CloudTrail で errorCode: AccessDenied event の eventName を特定し policy を拡張 |
Pod Identity env はあるが SDK が Unable to locate credentials と表示 | SDK が古く container credential provider(FULL_URI)をサポートしない | SDK を upgrade — 最低対応 versions は EKS docs に記載 |
IRSA と Pod Identity の仕組みおよび設定方法は EKS Security Best Practices と EKS Security に、token expiry と webhook issues は EKS Advanced Debugging — Control Plane Debugging にあります。
9. EKS: ENI/VPC CNI IP 枯渇
症状: pods が Events の FailedCreatePodSandBox とともに ContainerCreating で停止します:
Warning  FailedCreatePodSandBox  kubelet  Failed to create pod sandbox: rpc error: code = Unknown desc =
  failed to setup network for sandbox "...": plugin type="aws-cni" name="aws-cni" failed (add):
  add cmd: failed to assign an IP address to container
または scheduling 時に Too many pods で Pending のままです。どちらの症状にも共通する root は、node が pod に渡せる IP を持たないことです。
診断:
# Node max-pods (ENIs × (IPs per ENI − 1) + 2). An m6g.large is 29
kubectl get node <node> -o jsonpath='{.status.allocatable.pods}{"\n"}'
kubectl get pods -A --field-selector spec.nodeName=<node> --no-headers | wc -l

# aws-node status and IPAM settings
kubectl get pods -n kube-system -l k8s-app=aws-node -o wide
kubectl get ds -n kube-system aws-node -o jsonpath='{range .spec.template.spec.containers[?(@.name=="aws-node")].env[*]}{.name}={.value}{"\n"}{end}' | grep -E "PREFIX|WARM|MINIMUM|CUSTOM_NETWORK"

# Free IPs in the subnet
aws ec2 describe-subnets --subnet-ids <subnet-id> --query 'Subnets[].{id:SubnetId,az:AvailabilityZone,free:AvailableIpAddressCount}' --output table
VPC CNI のdefaultは WARM_ENI_TARGET=1 のみです(WARM_IP_TARGET/MINIMUM_IP_TARGET は未設定)。この状態では各 node が spare ENI を1つ丸ごと attach したままにします(m5.xlarge では ENI あたり15 IP)。そのため小さな subnets では pod count から想像するよりはるかに早く IP が尽きます。対照的に、この cluster の aws-node settings(ENABLE_PREFIX_DELEGATION=false、WARM_ENI_TARGET=1、WARM_IP_TARGET=3、MINIMUM_IP_TARGET=6)は、すでに縮小された warm pool の例です。WARM_IP_TARGET/MINIMUM_IP_TARGET が設定されると warm-ENI rule より優先されるため、node が保持する spare IP は pods の使用分に加えて3個だけで、合計 allocated IP は6個未満になりません(MINIMUM_IP_TARGET は spare count ではなく、in-use + spare の合計の floor です)。
原因と修正:
| 観測結果 | 原因 | 修正 |
|---|---|---|
Subnet の AvailableIpAddressCount が一桁 | subnet 自体が枯渇。warm pool が IP を事前確保 | WARM_IP_TARGET/MINIMUM_IP_TARGET で warm pool を縮小(上記 settings のように)、custom networking(ENIConfig)で secondary CIDR(例: 100.64.0.0/16)を追加し、長期的には IPv6 |
| node 上の Pods = allocatable pods | instance type の ENI/IP limit | Prefix delegation(ENABLE_PREFIX_DELEGATION=true、/28 prefixes を allocate、Nitro instances が必要)と max-pods 再計算、またはより大きい instance |
該当 node の aws-node が CrashLoopBackOff | CNI 自体の failure(AmazonEKS_CNI_Policy 不足、version mismatch) | kubectl logs -n kube-system <aws-node-pod> -c aws-node、node 上の /var/log/aws-routed-eni/ipamd.log |
Security Groups for Pods を使用し vpc.amazonaws.com/pod-eni が不足 | Branch ENI limit | trunk ENIs 対応 instances に移行。ENABLE_POD_ENI=true を確認 |
IPAM behavior(warm pool、prefix delegation、custom networking)は VPC CNI — IP Address Management (English) に、段階的な IP exhaustion handling は EKS Advanced Debugging — Networking Diagnostics と EKS Troubleshooting — VPC CNI Issues にあります。
10. EKS: Karpenter が node を起動しない
症状: pods は Pending で、kubectl get nodeclaims に新しい NodeClaim が表示されません。default scheduler の FailedScheduling とは別に、Karpenter は同じ pod の events に自身の reasons を記録します。
診断:
# Events emitted by Karpenter (source is karpenter)
kubectl get events -n <ns> --field-selector involvedObject.name=<pod> -o custom-columns=REASON:.reason,SRC:.source.component,MSG:.message

# NodePool limits vs current usage
kubectl get nodepool -o custom-columns='NAME:.metadata.name,CPU_LIMIT:.spec.limits.cpu,CPU_USED:.status.resources.cpu,MEM_LIMIT:.spec.limits.memory,MEM_USED:.status.resources.memory,READY:.status.conditions[?(@.type=="Ready")].status'

# NodeClaim progress
kubectl get nodeclaims -o custom-columns='NAME:.metadata.name,TYPE:.metadata.labels.node\.kubernetes\.io/instance-type,LAUNCHED:.status.conditions[?(@.type=="Launched")].status,REGISTERED:.status.conditions[?(@.type=="Registered")].status,READY:.status.conditions[?(@.type=="Ready")].status'

kubectl logs -n kube-system -l app.kubernetes.io/name=karpenter --tail=100
実際の Karpenter event(1つの pod に対してすべての NodePool を走査し、各々が拒否された理由を列挙します):
FailedScheduling  karpenter  Failed to schedule pod, incompatible with nodepool "system",
  daemonset overhead={"cpu":"821m","memory":"1350Mi","pods":"10"}, incompatible requirements,
  label "nvidia.com/device-plugin.config" does not have known values;
  incompatible with nodepool "runner-arm", ..., did not tolerate workload-type=ci-runner:NoSchedule;
  all available instance types exceed limits for nodepool "graviton";
  incompatible with nodepool "gpu-ner", ..., incompatible requirements, key node.kubernetes.io/instance-type,
  node.kubernetes.io/instance-type In [g6e.4xlarge] not in node.kubernetes.io/instance-type In [g6.2xlarge g6.4xlarge g6.xlarge]
同時点の NodePool status では graviton が CPU_LIMIT 8 / CPU_USED 8、つまりlimit ちょうどでした。これが exceed limits の意味です。反対に、Nominated karpenter Pod should schedule on: nodeclaim/system-tm4gv は Karpenter の処理が終わり、node が立ち上がるのを待っていることを意味します。
原因と修正:
| メッセージ断片 | 原因 | 修正 |
|---|---|---|
all available instance types exceed limits for nodepool "<np>" | NodePool spec.limits(cpu/memory)到達 | limit を上げるか、consolidation が idle nodes を回収していないか確認 |
label "<key>" does not have known values | pod の nodeSelector/affinity key が NodePool requirements にない | NodePool の spec.template.spec.requirements に key(value list 付き)を追加 |
did not tolerate <key>=<value>:NoSchedule | NodePool taints に対応する toleration がない | isolation が意図的なら別の NodePool を使用し、そうでなければ toleration を追加 |
key node.kubernetes.io/instance-type, ... In [X] not in ... In [Y Z] | pod が NodePool で許可されない instance type を要求 | どちらかを合わせる。通常は pod-side requirement が狭すぎる |
大きい daemonset overhead={...} と Insufficient | DaemonSet reservations を差し引くと capacity が不足 | requirements により大きい instances を含める |
NodeClaim の LAUNCHED=True, REGISTERED=False が数分続く | EC2 は起動したが node が join できない(EC2NodeClass subnet/SG selectors、node IAM role access entry、AMI) | kubectl describe nodeclaim <name> の Conditions/Events、EC2 console system log |
Karpenter logs の InsufficientInstanceCapacity | その AZ/instance type に EC2 capacity がない(ICE — Insufficient Capacity Error) | instance types、AZs、capacity-type(spot/on-demand)を広げる |
| events がなく Karpenter logs も静か | pod が Karpenter candidate ではない(nodeSelector が MNG labels を指定、または Karpenter と無関係な scheduling constraints) | pod spec のすべての node-related constraint を再確認 |
NodePool/EC2NodeClass structure と詳細な troubleshooting は Karpenter — Troubleshooting と EKS Advanced Debugging — Karpenter Provisioning Issues にあります。
11. Service を作成できない: failed calling webhook
症状: load balancers と関係のない namespace を含む任意の namespace で、Service の kubectl apply/create が API server に拒否されます。Service を含む Deployments、Helm installs、ArgoCD syncs はそこで停止します。一方で既存 Services は動作し続けるため、pod level では異常が見えません。
Internal error occurred: failed calling webhook "mservice.elbv2.k8s.aws": failed to call webhook:
... no endpoints available for service "aws-load-balancer-webhook-service"診断: message はすでに webhook とその背後の Service を示しています。webhook configuration → webhook Service の endpoints → それらを背後で支える Deployment の順に追います。
# (1) Which webhooks are registered, and what each does on failure (rules, namespaceSelector, objectSelector, failurePolicy)
kubectl get mutatingwebhookconfigurations,validatingwebhookconfigurations
kubectl get mutatingwebhookconfiguration aws-load-balancer-webhook -o jsonpath='{range .webhooks[*]}{.name}{"\t"}failurePolicy={.failurePolicy}{"\t"}ns={.namespaceSelector}{"\t"}obj={.objectSelector}{"\t"}{.rules[*].operations}{" "}{.rules[*].resources}{"\n"}{end}'

# (2) Is there a Ready pod behind the webhook Service?
kubectl -n kube-system get endpointslices -l kubernetes.io/service-name=aws-load-balancer-webhook-service

# (3) Why does that Deployment keep dying?
kubectl -n kube-system get pods -l app.kubernetes.io/name=aws-load-balancer-controller
kubectl -n kube-system logs deploy/aws-load-balancer-controller --previous
この cluster が2026年9月2日に実際に示した状態: aws-load-balancer-controller v3.2.1(2 replicas)は、48日間 CrashLoopBackOff、9,250 restarts の状態でした。各 --previous log は同じ pattern を示しました(timestamps 以外の一部 fields を省略):
{"ts":"2026-09-02T07:54:42Z","logger":"setup","msg":"Disabling NLBGatewayAPI: missing required Gateway API CRDs","missing":["TLSRoute","TCPRoute","UDPRoute"]}
{"level":"error","logger":"controller-runtime.source.Kind","msg":"if kind is a CRD, it should be installed before calling Start","kind":"ListenerSet.gateway.networking.k8s.io","error":"no matches for kind \"ListenerSet\" in version \"gateway.networking.k8s.io/v1\""}
{"ts":"2026-09-02T07:57:00Z","level":"error","logger":"setup","msg":"problem running manager","error":"failed to wait for gateway.k8s.aws/alb caches to sync kind source: *v1.ListenerSet: timed out waiting for cache to be synced for Kind *v1.ListenerSet"}
読み方: controller の ALB Gateway API controller は ListenerSet CRD(Gateway API experimental channel)を期待していますが、cluster には存在しません。NLB side は CRDs がないと無効化されます(1行目、info)が、ALB side は cache の sync を待ち、約2分18秒後に process が終了します。そのため pod は一瞬 Running に見えて再び終了し、webhook Service の endpoints は大半の時間で空になります。同時に mservice.elbv2.k8s.aws webhook は failurePolicy: Fail、namespaceSelector: {}(すべての namespace)、objectSelector: app.kubernetes.io/name NotIn [aws-load-balancer-controller]、Service CREATE の rule を持ちます。つまり、この webhook Deployment の可用性は cluster 全体の Service 作成の可用性であり、endpoints がゼロになった瞬間に API server はすべての一致する request を拒否します。この状態でも Pod creation は影響を受けず、pods は正常に作成されました。
原因と修正:
| 観測結果 | 原因 | 修正 |
|---|---|---|
no endpoints available for service "aws-load-balancer-webhook-service" | webhook Deployment に Ready pods がゼロ(CrashLoop、unschedulable、replicas 0) | 最初に controller を健全にする(次行)。get endpointslices の ENDPOINTS column に addresses が表示されることで recovery を確認 |
logs に no matches for kind "ListenerSet" → timed out waiting for cache to be synced | この controller version が必要とする Gateway API CRDs が未インストール | (a) controller version が必要とする Gateway API CRDs を install — ListenerSet は experimental channel、(b) CRDs を配置するまで Helm feature-gate values で controller の Gateway API feature を無効化(その version の values.yaml で正確な gate names を確認)、(c) installed CRDs と合う controller version に pin |
Endpoints はあるが connection refused / context deadline exceeded / x509 | webhook port への path が block(NetworkPolicy/security group)、certificate の expiry または mismatch | API server → pod webhook-port path、clientConfig.caBundle、certificate renewal を確認 |
| 今すぐ Service を作成する必要がある | — | blast radius を理解した上での緊急措置としてのみ: mservice.elbv2.k8s.aws の failurePolicy を Ignore に patch。この間に作成した Services には controller の mutation(default loadBalancerClass)が inject されないため、recovery 後に Fail に戻し、その間に作成した Services を確認 |
行ってはいけないこと: objectSelector を回避するため Service に app.kubernetes.io/name=aws-load-balancer-controller label を付けることです。webhook は通過しますが、その Service はcontroller の管理対象から暗黙に外れ(mutation が適用されない)、label も偽りになります。この selector は controller 自身の Service を作成できるようにするためだけに存在します。
防止策: (1) webhook Service に ready address がないときに alert を設定 — kube-state-metrics では (sum(kube_endpoint_address{namespace="kube-system", endpoint="aws-load-balancer-webhook-service", ready="true"}) or vector(0)) == 0(zero addresses では series が 0 ではなく消えるため、or vector(0) が重要)— または controller の CrashLoopBackOff を alert します。この cluster は2 replicas を実行していましたが、両方とも同じ理由で終了したため replica count はこの failure から保護しません。(2) すべての namespace に一致する failurePolicy: Fail webhooks を定期的に review: kubectl get mutatingwebhookconfigurations -o json | jq '.items[].webhooks[] | select(.failurePolicy=="Fail") | {name, namespaceSelector, rules}'。(3) webhook Deployments は少なくとも2 replicas を AZs に分散し PDB とともに実行 — これは node/AZ loss を防ぎます。configuration errors には (1) が答えです。
この outage が Pod Network Benchmark の ClusterIP(kube-proxy)measurements を妨げた原因です。webhook を bypass したのではなく、benchmark は Pod IPs のみを使用しました。
kubectl 診断チートシート
このドキュメントで使用したすべての commands を目的別にまとめています。いずれも read-only です。
# ── Status scan ────────────────────────────────────────────────────────
# Unhealthy pods only
kubectl get pods -A --field-selector=status.phase!=Running,status.phase!=Succeeded
# Restart counts ascending, so the 15 worst pods come LAST (after tail) + last termination reason.
# Reads the first container only ([0]); for multi-container pods check the others separately.
kubectl get pods -A --sort-by='.status.containerStatuses[0].restartCount' \
  -o custom-columns='NS:.metadata.namespace,NAME:.metadata.name,RESTARTS:.status.containerStatuses[0].restartCount,REASON:.status.containerStatuses[0].lastState.terminated.reason' | tail -15
# Pods on a given node
kubectl get pods -A --field-selector spec.nodeName=<node> -o wide
# Node conditions + zone + instance type
kubectl get nodes -o custom-columns='NAME:.metadata.name,READY:.status.conditions[?(@.type=="Ready")].status,DISK:.status.conditions[?(@.type=="DiskPressure")].status,MEM:.status.conditions[?(@.type=="MemoryPressure")].status,ZONE:.metadata.labels.topology\.kubernetes\.io/zone,TYPE:.metadata.labels.node\.kubernetes\.io/instance-type'

# ── Events ─────────────────────────────────────────────────────────────
kubectl get events -A --field-selector type=Warning --sort-by=.lastTimestamp | tail -30
kubectl get events -n <ns> --field-selector involvedObject.name=<pod>,reason=FailedScheduling
kubectl events -n <ns> --for pod/<pod> --watch          # follow one object live
kubectl events -A --types=Warning                       # kubectl events subcommand (1.26+)

# ── jsonpath for exactly the fields you need ──────────────────────────
kubectl get pod <pod> -o jsonpath='{.status.containerStatuses[*].lastState.terminated}'
kubectl get pod <pod> -o jsonpath='{range .spec.containers[*]}{.name}{": "}{.resources}{"\n"}{end}'
kubectl get svc <svc> -o jsonpath='{.spec.selector}'
kubectl get sa <sa> -o jsonpath='{.metadata.annotations.eks\.amazonaws\.com/role-arn}'
kubectl get pv <pv> -o jsonpath='{.spec.nodeAffinity.required.nodeSelectorTerms[0].matchExpressions}'

# ── Logs ───────────────────────────────────────────────────────────────
kubectl logs <pod> -c <container> --previous --tail=100   # logs of the dead container
kubectl logs -n kube-system -l k8s-app=kube-dns --tail=50  # several pods by label
kubectl logs deploy/<name> --all-containers --since=10m

# ── Debug containers ───────────────────────────────────────────────────
# Attach an ephemeral container to a distroless pod (shares the process namespace)
kubectl debug -it <pod> --image=nicolaka/netshoot --target=<container>
# Copy of the pod with a different image/command
kubectl debug <pod> -it --copy-to=<pod>-debug --container=<container> -- sh
# Node shell without SSH. --profile=sysadmin is a privileged container
kubectl debug node/<node> -it --image=busybox --profile=sysadmin -- chroot /host

# ── Resource usage (requires metrics-server) ───────────────────────────
kubectl top nodes
kubectl top pods -n <ns> --sort-by=memory
# Without metrics-server: "error: Metrics API not available"

# ── Schema lookup ──────────────────────────────────────────────────────
kubectl explain pod.status.containerStatuses.lastState.terminated
kubectl explain nodepool.spec.limits        # works for CRDs too
kubectl api-resources | grep -E "karpenter|k8s.aws"

# ── Rollouts ───────────────────────────────────────────────────────────
kubectl rollout status deploy/<name> -n <ns>
kubectl rollout history deploy/<name> -n <ns>
kubectl debug の有効な --profile values は legacy、general、baseline、restricted、netadmin、sysadmin です(default は kubectl version により legacy または general — kubectl debug --help で確認)。Pod Security Standards を強制する namespace では、admission を通すため restricted を使用します。
より深く調べる: 関連ドキュメント
このプレイブックは「次にどこへ進むか」を決める入口です。原因を絞り込んだら、以下のドキュメントへ進んでください。
| 絞り込んだ領域 | 概念ドキュメント | 詳細 troubleshooting |
|---|---|---|
| Pod lifecycle、probes、restart policy | Pods and Workloads | EKS Advanced Debugging — Workload Debugging |
| Service、EndpointSlice、CoreDNS、NetworkPolicy | Services and Networking、Network Policies | EKS Troubleshooting — Networking Issues |
| PV/PVC/StorageClass、EBS CSI | Storage | EKS Troubleshooting — Storage Issues |
| Node join、kubelet、resource pressure | Cluster Architecture | EKS Troubleshooting — Node and Pod Issues |
| Karpenter NodePool/NodeClaim | Karpenter | Scaling Strategies |
| VPC CNI IPAM、prefix delegation、custom networking | VPC CNI | EKS Networking Part 3: Troubleshooting |
| IRSA、Pod Identity、RBAC | EKS Security Best Practices、Kubernetes Authentication and Authorization | EKS Troubleshooting — IAM and Authentication Issues |
| logs の場所と探し方 | Logging Overview | Observability Analysis |
| requests/limits、OOM、JVM memory | Resource Optimization | EKS Troubleshooting — Performance Issues |
| Incident response process、severity、最初の5分 checklist | — | EKS Advanced Debugging — Incident Response Framework |
参照先
このページの引用文字列と経験則を裏付ける公式 documentation です。
Kubernetes
- Taints and Tolerations — node controller が自動追加する
node.kubernetes.io/*taints(section 6) - Debugging Kubernetes Nodes with kubectl と
kubectl debugreference — node debug pods と--profilevalues(sections 2、6、cheat sheet) - Debug Running Pods — ephemeral containers、
--copy-to、--target(cheat sheet) - EndpointSlices — 1.33 以降に
v1 Endpointsが deprecated である理由(section 4) - Debug Services と Debugging DNS Resolution — selector/port/DNS checks と
ndots(section 5)
Amazon EKS / AWS
- Amazon VPC CNI plugin README —
WARM_ENI_TARGET、WARM_IP_TARGET、MINIMUM_IP_TARGET、ENABLE_PREFIX_DELEGATIONの semantics と precedence(section 9) - Assign more IP addresses to Amazon EKS nodes with prefixes — prefix delegation と max-pods recalculation(section 9)
- EKS Pod Identity と IAM roles for service accounts — trust policy shapes と inject される environment variables(section 8)
- Detect node health issues and enable automatic node repair — section 6 に示した Node Monitoring Agent conditions
- Troubleshoot problems with Amazon EKS clusters and nodes — node join failures、
AccessDenied、CNI errors - Karpenter — Troubleshooting — NodePool limits、requirement mismatches、NodeClaim launch/registration failures(section 10)