アラートの概要
最終更新: September 13, 2026
レビュー基準: Prometheus 3.14.0 および Alertmanager 0.34.0。例では単一の cluster と重複排除された series を前提としています。実際の job、label、exporter、metric の可用性を検証してから、threshold を調整してください。ローカルの rule/routing チェックのみを実行しており、cluster または通知 channel は実施していません。
目次
アラートの役割と重要性
オブザーバビリティの 3 つの柱におけるアラートの位置付け
Metrics、logs、traces は一般的なオブザーバビリティシグナルです。profiles やその他のシグナルも存在します。rule engine が必ずしもこれら 3 つすべてを直接評価するとは限りません。
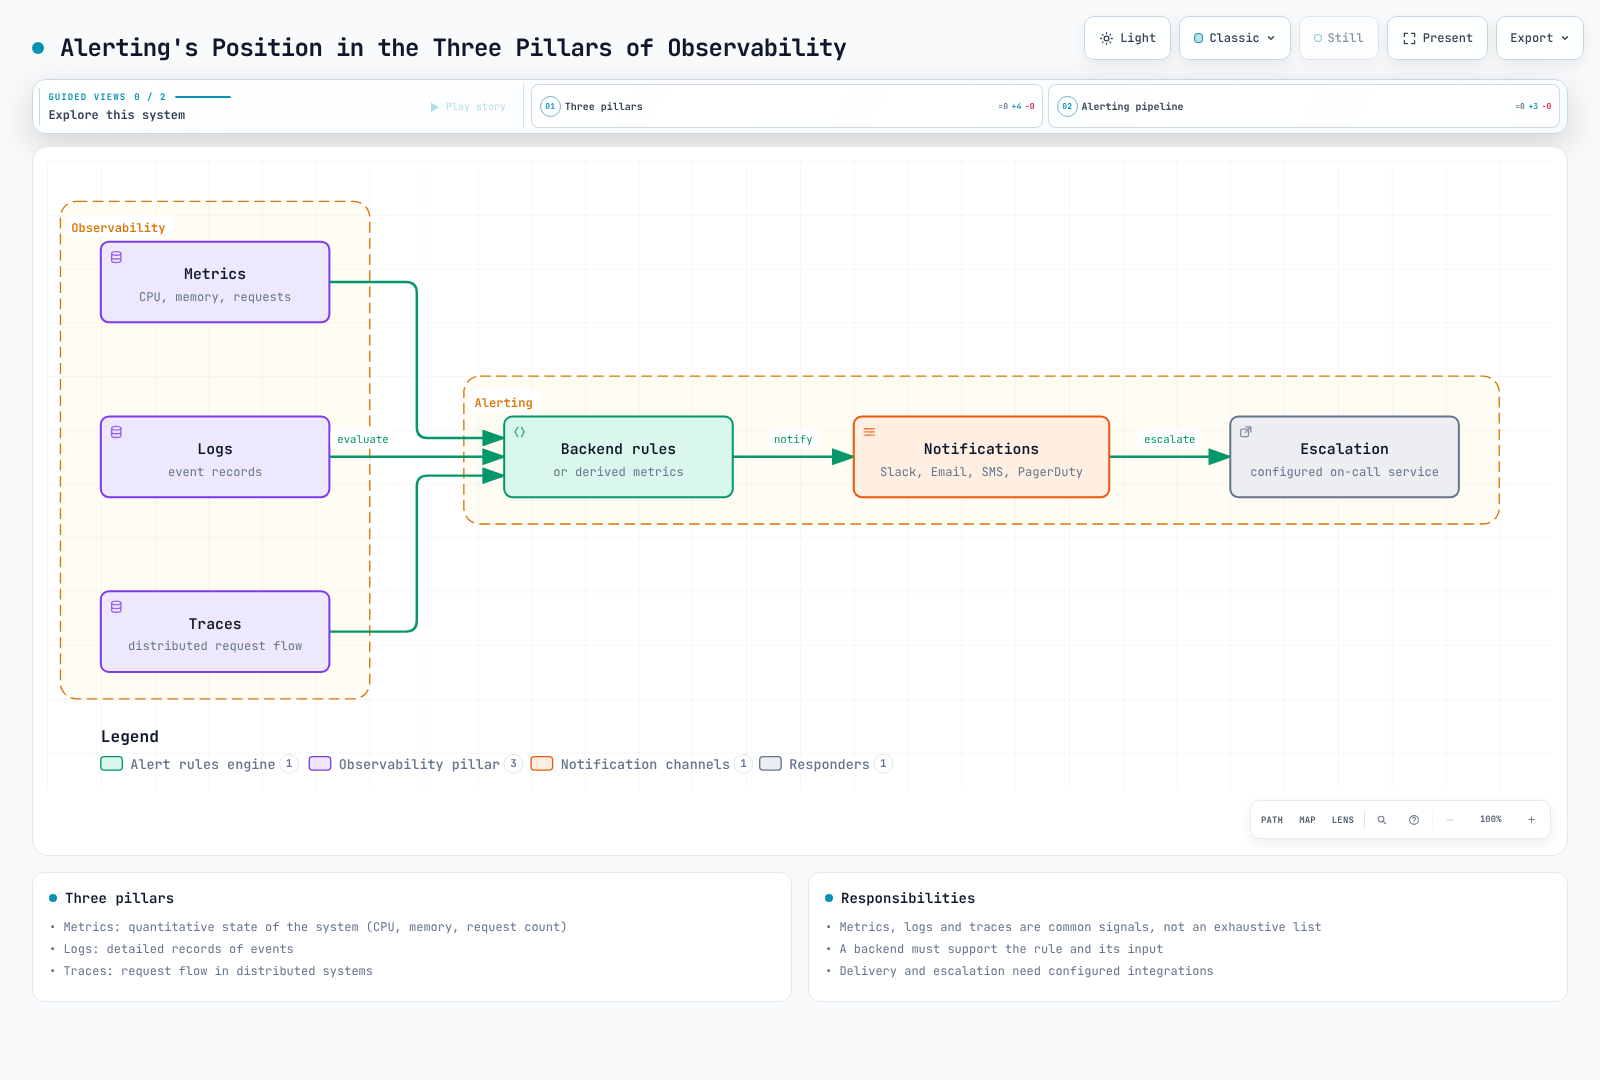
- Metrics: システムの定量的な状態(CPU、memory、request 数など)
- Logs: event の詳細な記録
- Traces: 分散システムにおける request の流れ
Prometheus rule は metrics を評価します。logs と traces は、backend 固有の rule または導出された metrics を通じてアラートに供給されます。検知、通知、人による確認応答は別々の段階であり、配信成功も独自に監視する必要があります。
アラートが必要な理由
- プロアクティブな問題対応: ユーザーが問題を経験する前に問題を検出する
- ダウンタイムの最小化: 迅速な検出と対応によりサービスの可用性を向上させる
- コスト削減: 自動監視により人件費を削減する
- SLA/SLO の遵守: サービスレベル目標を達成するための不可欠な要素
- インシデントの記録: 問題発生の履歴を追跡および分析する
良いアラートと悪いアラート
| 観点 | 良いアラート | 悪いアラート |
|---|---|---|
| 実行可能性 | 即時の対応が必要 | 情報のみで、対応不要 |
| 明確性 | 問題が何か明確 | 曖昧で不明確 |
| 緊急度 | 緊急度が重大度に一致する | すべてが緊急扱い |
| 頻度 | 適切な頻度 | 頻度が高すぎる、または低すぎる |
| 重複 | 関連アラートがグループ化される | 同じ問題に対して数十件のアラート |
アラートのライフサイクル
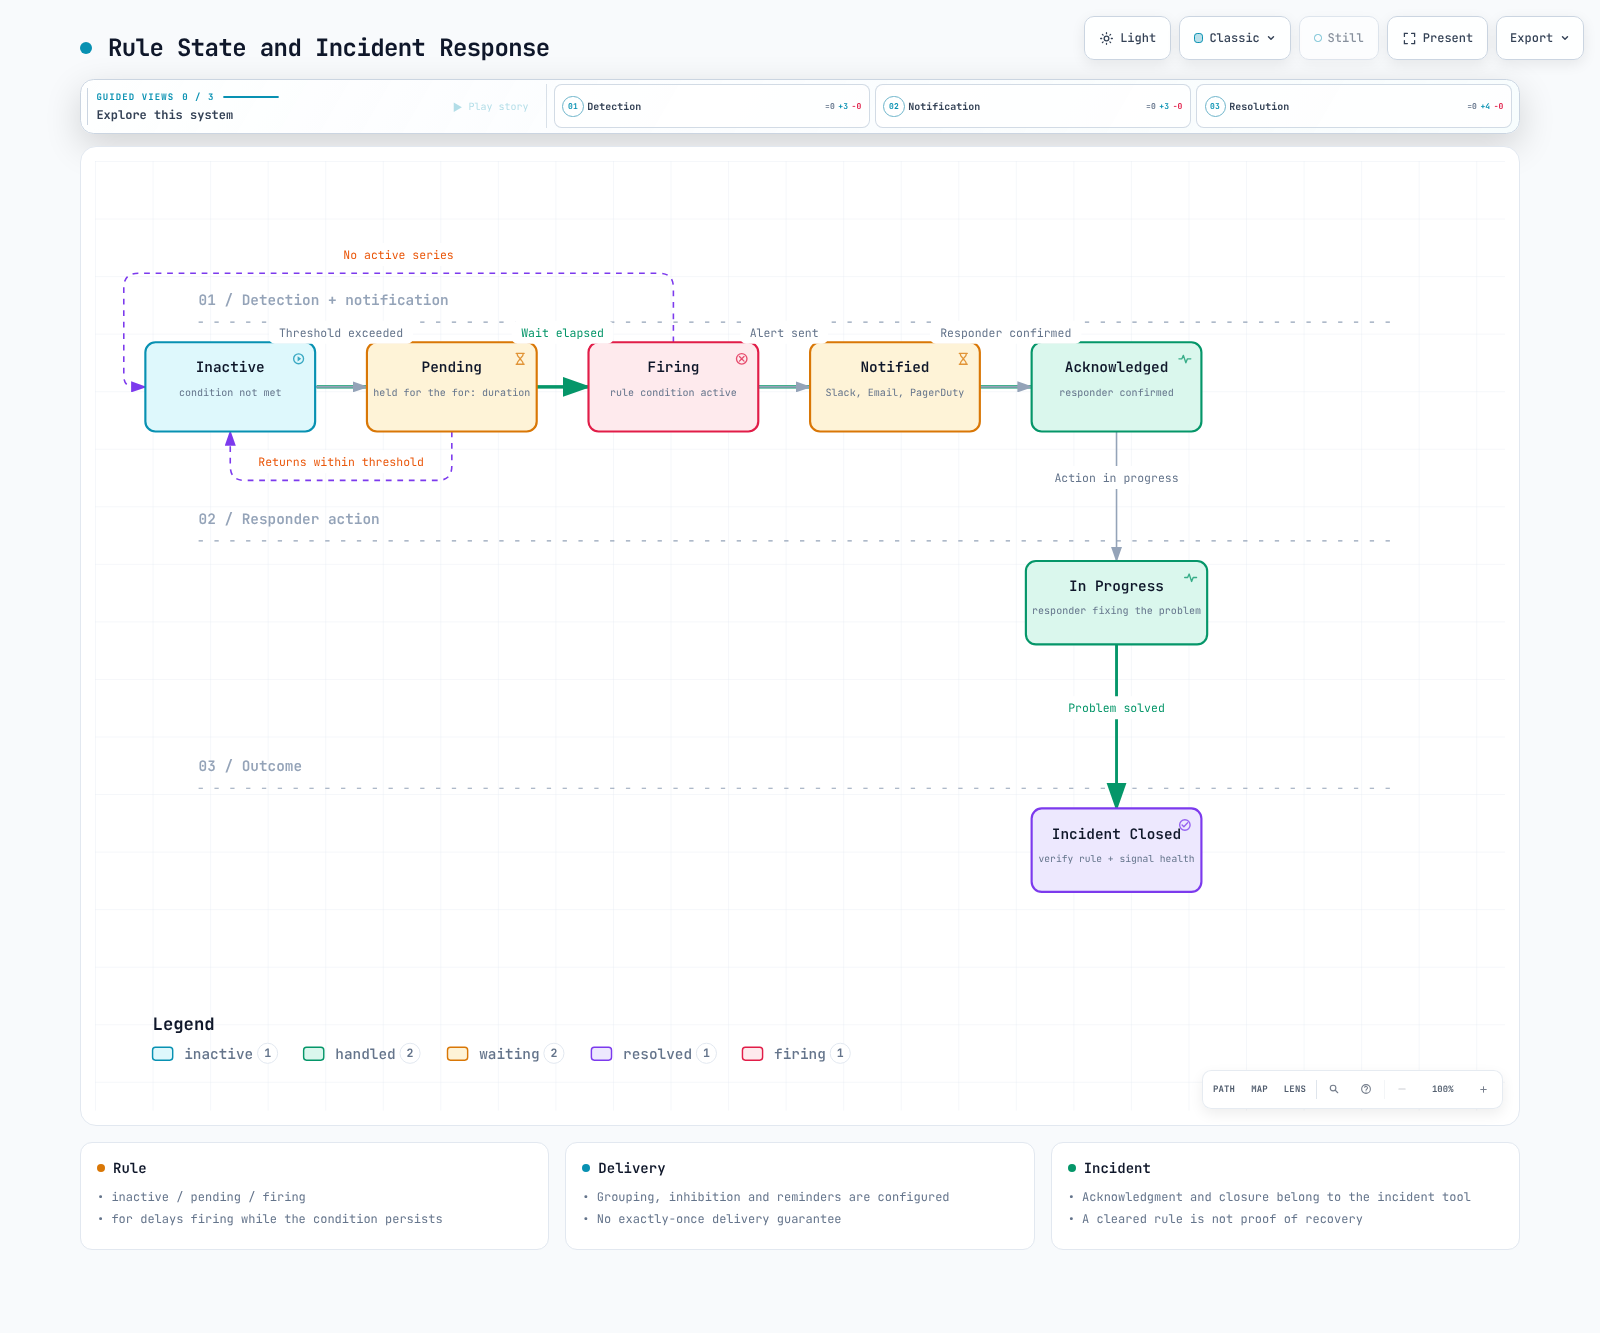
この図は rule state と incident response を組み合わせています。Prometheus は inactive/pending/firing を使用します。確認応答と対応中はオンコールツールに属します。incident をクローズしても、firing 中の rule は解除されません。time series が消失すると rule が非アクティブ化される場合もあるため、復旧の証拠として扱ってはなりません。
1. 検知
- しきい値ベース: 特定の値が設定済みのしきい値を超えたとき
- 変化率ベース: 変化率が異常なとき
- 異常検知: 機械学習ベースの異常パターン検知
- ログパターン: 特定のログパターンが発生したとき
groups:
  - name: node-alerts
    rules:
      - alert: HighCPUUsage
        expr: 100 * (1 - avg by (cluster, instance) (rate(node_cpu_seconds_total{mode="idle"}[5m]))) > 80
        for: 5m
        labels:
          severity: warning
          team: sre
        annotations:
          summary: "High CPU usage detected"
          description: "CPU usage is above 80% for 5 minutes on {{ $labels.instance }}"
2. 通知
- channel の選択: Slack、Email、SMS、PagerDuty など
- routing: アラートタイプに基づいて適切な receiver に配信する
- grouping: 関連するアラートをまとめる
- 重複排除: 重複する通知を減らす。exactly-once の保証はなく、repeat_interval のリマインダーと retry は引き続き発生する可能性があります
3. エスカレーション
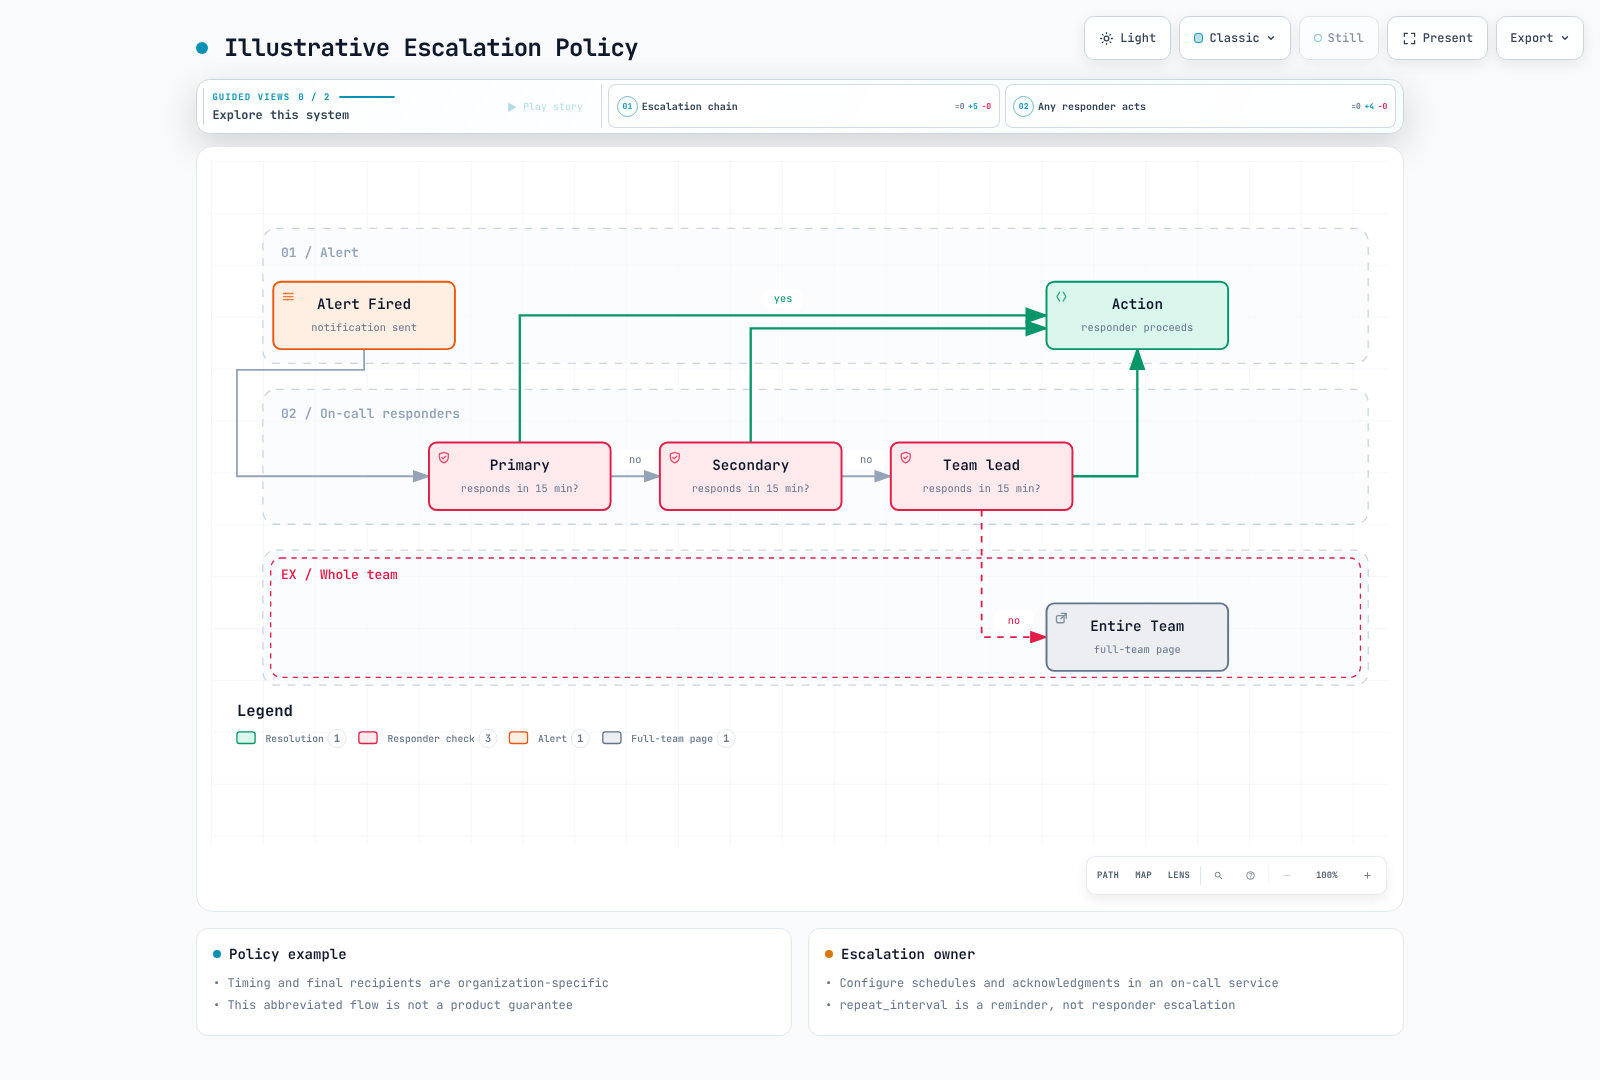
- 時間ベース: 指定時間内に応答がない場合、次の responder にエスカレーションする
- 重大度ベース: 重大度に応じて異なるエスカレーションパスを使用する
- 自動エスカレーション: オンコールサービスで設定します。Alertmanager の repeat_interval は確認応答を確認せず、responder も交代させません
4. 解決
- 手動解決: responder が incident tool で incident をクローズします。rule state は別途確認します
- 自動解決: rule と collection health を確認後、integration policy に従って incident state を更新します
- 解決通知: 問題が修正されたときに解決通知を送信します
アラート設計の原則
1. 実行可能なアラート
人を中断させる page には、即時に実行可能な対応が必要です。情報提供の event や長期的な作業は、代わりに ticket または dashboard に送ることができます。
悪い例:
Alert: Database connection count increased良い例:
Alert: Database connection pool exhausted
Action Required: Confirm user impact; inspect pool saturation and connection leaks using the runbook
Runbook: https://example.com/runbooks/replace-db-runbook
2. アラート疲れの防止
アラートが多すぎると、重要なアラートを見逃すおそれがあります。
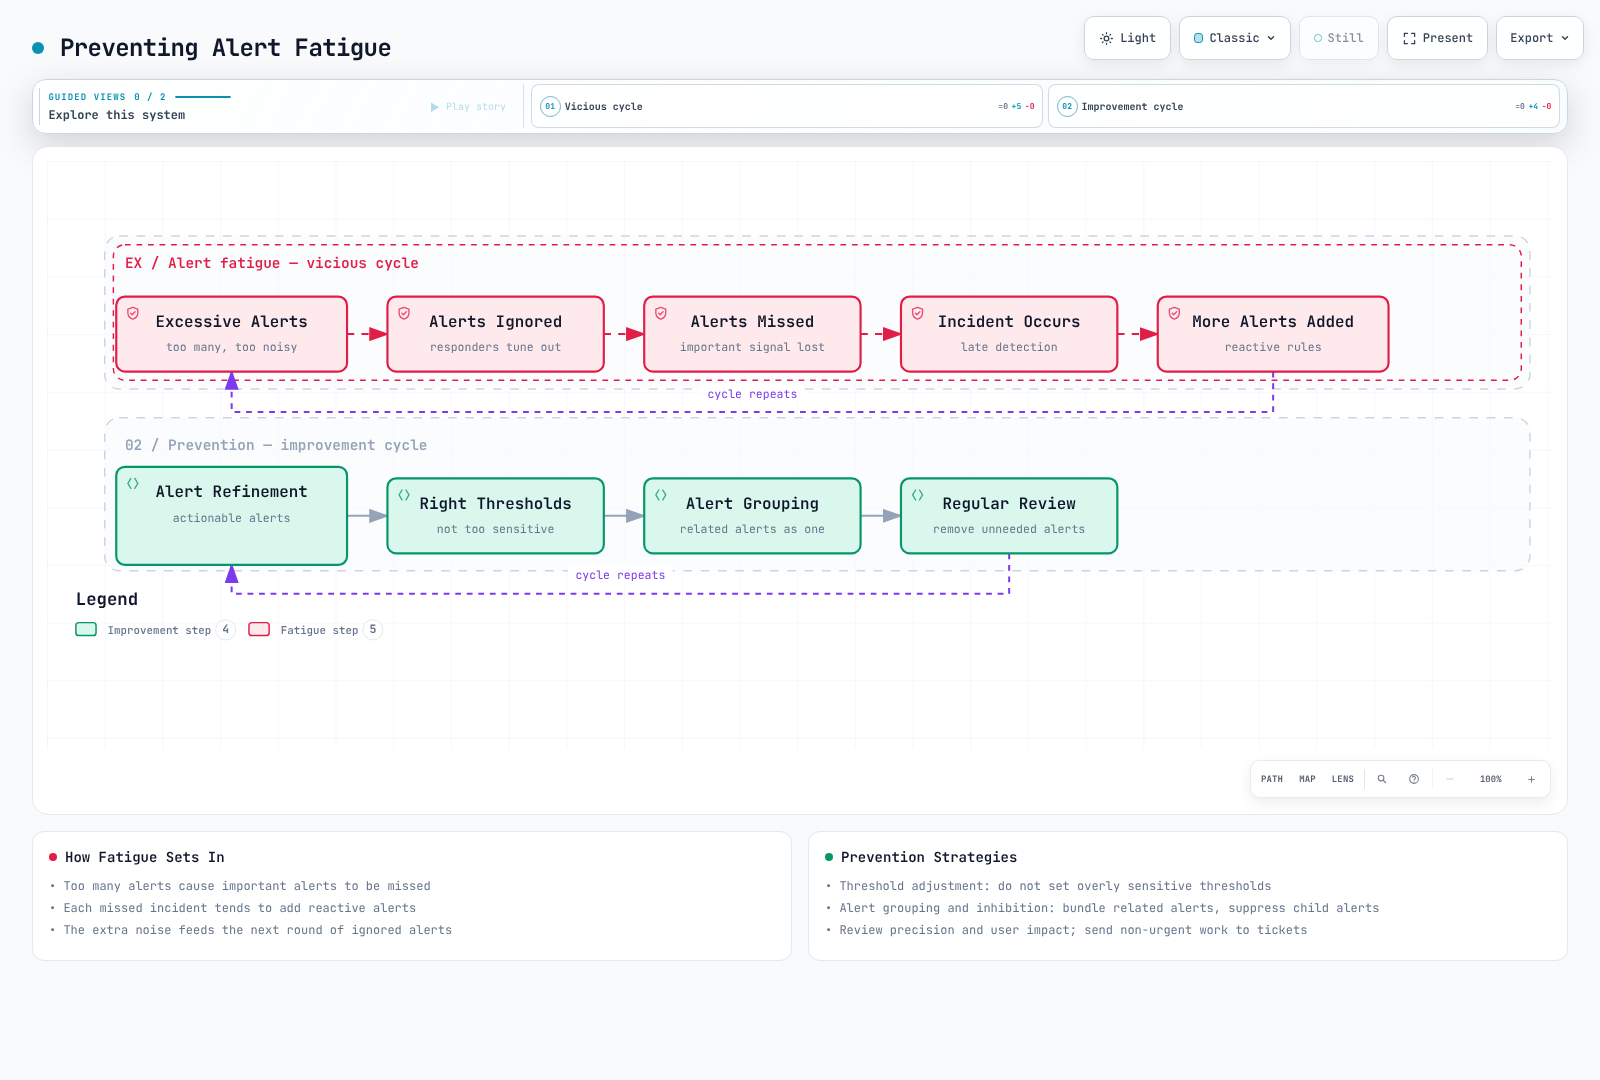
アラート疲れを防ぐ戦略:
- しきい値の調整: 過敏すぎるしきい値を設定しない
- アラートのグループ化: 関連するアラートを 1 つにまとめる
- 抑制: 親アラートが firing したときに子アラートを抑制する
- 定期的なレビュー: 不要なアラートを削除する
- 段階的な導入: 新しいアラートは最初に低い重大度で開始する
3. 重大度レベル
これらの応答時間は例示的な組織 policy であり、製品の SLA や普遍的な推奨ではありません。
| 重大度 | 説明 | 応答時間 | 例 |
|---|---|---|---|
| Critical | 完全なサービス停止 | 即時(5 分以内) | サービス全体の停止、データ損失リスク |
| High | 主要機能の障害 | 15 分以内 | 決済システムエラー、ログイン失敗 |
| Warning | 潜在的な問題 | 1 時間以内 | disk 使用率 80%、response latency の増加 |
| Info | 情報アラート | 営業時間内 | Deployment 完了、backup 成功 |
groups:
  - name: disk-alerts
    rules:
      - alert: DiskSpaceCritical
        expr: |
          (100 * node_filesystem_avail_bytes{fstype!~"tmpfs|overlay|squashfs"}
            / node_filesystem_size_bytes{fstype!~"tmpfs|overlay|squashfs"} < 5)
          and node_filesystem_readonly == 0
          and node_filesystem_size_bytes > 0
        for: 5m
        labels:
          severity: critical
          team: sre
        annotations:
          summary: "Disk space critical"
      - alert: DiskSpaceWarning
        expr: |
          (100 * node_filesystem_avail_bytes{fstype!~"tmpfs|overlay|squashfs"}
            / node_filesystem_size_bytes{fstype!~"tmpfs|overlay|squashfs"} < 20)
          and node_filesystem_readonly == 0
          and node_filesystem_size_bytes > 0
        for: 10m
        labels:
          severity: warning
          team: sre
        annotations:
          summary: "Disk space low"
4. アラートのドキュメント化
すべてのアラートには、以下の情報を含める必要があります。
- 説明: アラートの意味
- 影響: この問題がサービスに与える影響
- 対応手順: 問題を解決するための段階的なガイド
- Runbook link: 詳細な対応手順ドキュメント
annotations:
  summary: "Investigate the affected operation"
  description: "Check the rule expression, its units, labels, and collection health."
  impact: "Document the affected user operation before paging."
  action: "Use the owning team's reviewed runbook; do not scale resources blindly."
  runbook_url: "https://example.com/runbooks/replace-with-reviewed-runbook"
アラートのルーティングとエスカレーション
ルーティング戦略
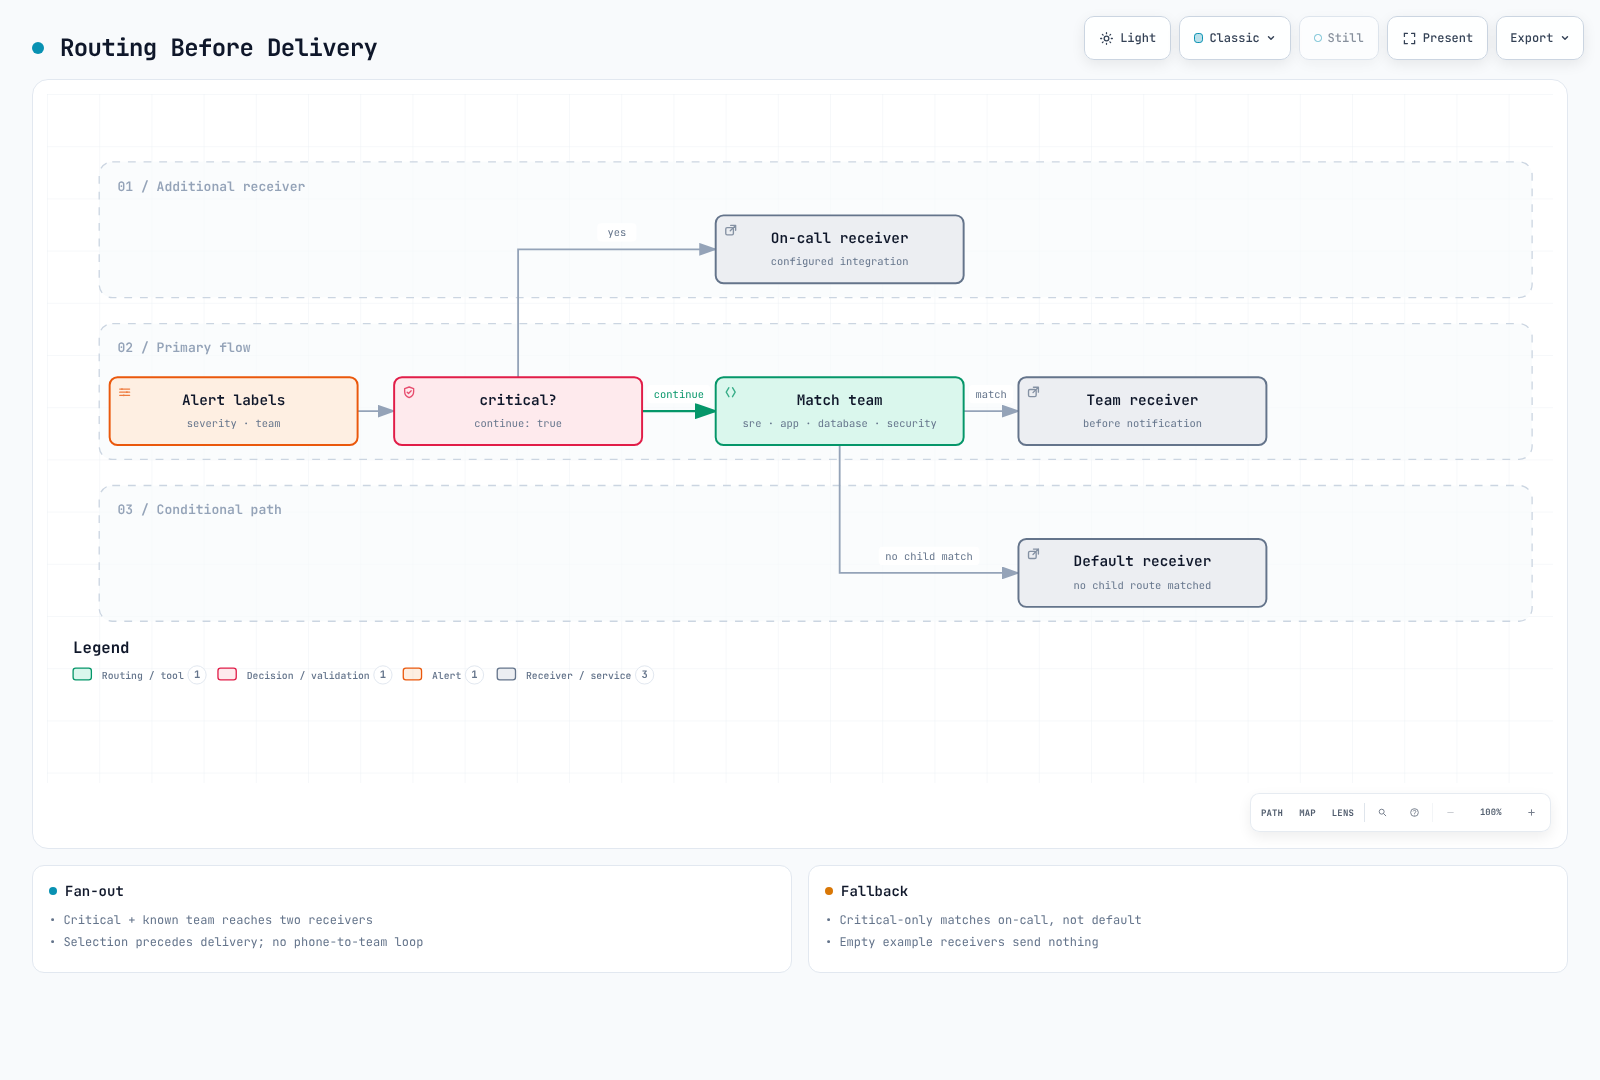
アラートは、さまざまな基準に基づいて適切な receiver に配信する必要があります。
ルーティングツリーの設計
これは完全な通知を行わない routing-validation 設定です。空の receiver は意図的なものです。本番利用前に、レビュー済みの integration と Secret file を設定してください。critical アラートはオンコール receiver と一致する team に fan out します。team label がない場合は default にフォールバックしますが、critical-only の一致では default も呼び出されません。grouping delay があるため、即時に電話される保証はありません。disk critical は、同じ instance/device/mountpoint の warning のみを抑制します。
route:
  receiver: default-receiver
  group_by: [alertname, cluster, namespace, service]
  group_wait: 30s
  group_interval: 5m
  repeat_interval: 4h
  routes:
    - matchers: ['severity="critical"']
      receiver: critical-oncall
      continue: true
    - matchers: ['team="sre"']
      receiver: sre-team
    - matchers: ['team="app"']
      receiver: dev-team
    - matchers: ['team="database"']
      receiver: dba-team
    - matchers: ['team="security"']
      receiver: security-team
receivers:
  - name: default-receiver
  - name: critical-oncall
  - name: sre-team
  - name: dev-team
  - name: dba-team
  - name: security-team
inhibit_rules:
  - source_matchers: ['alertname="DiskSpaceCritical"', 'instance!=""', 'device!=""', 'mountpoint!=""']
    target_matchers: ['alertname="DiskSpaceWarning"', 'instance!=""', 'device!=""', 'mountpoint!=""']
    equal: [cluster, instance, device, mountpoint]
エスカレーションポリシー
以下は例示です。オンコールサービスで time zone、確認応答の時間枠、backup、再 page の動作を設定し、drill でテストしてください。
| 手順 | 時間 | 対象 | channel |
|---|---|---|---|
| 1 | 0 分 | Primary on-call | Slack、PagerDuty |
| 2 | 15 分 | Secondary on-call | Slack、PagerDuty、SMS |
| 3 | 30 分 | Team Lead | Slack、PagerDuty、電話 |
| 4 | 45 分 | Engineering Manager | 電話 |
| 5 | 60 分 | CTO/VP Engineering | 電話 |
オンコールローテーション
オンコールの概念
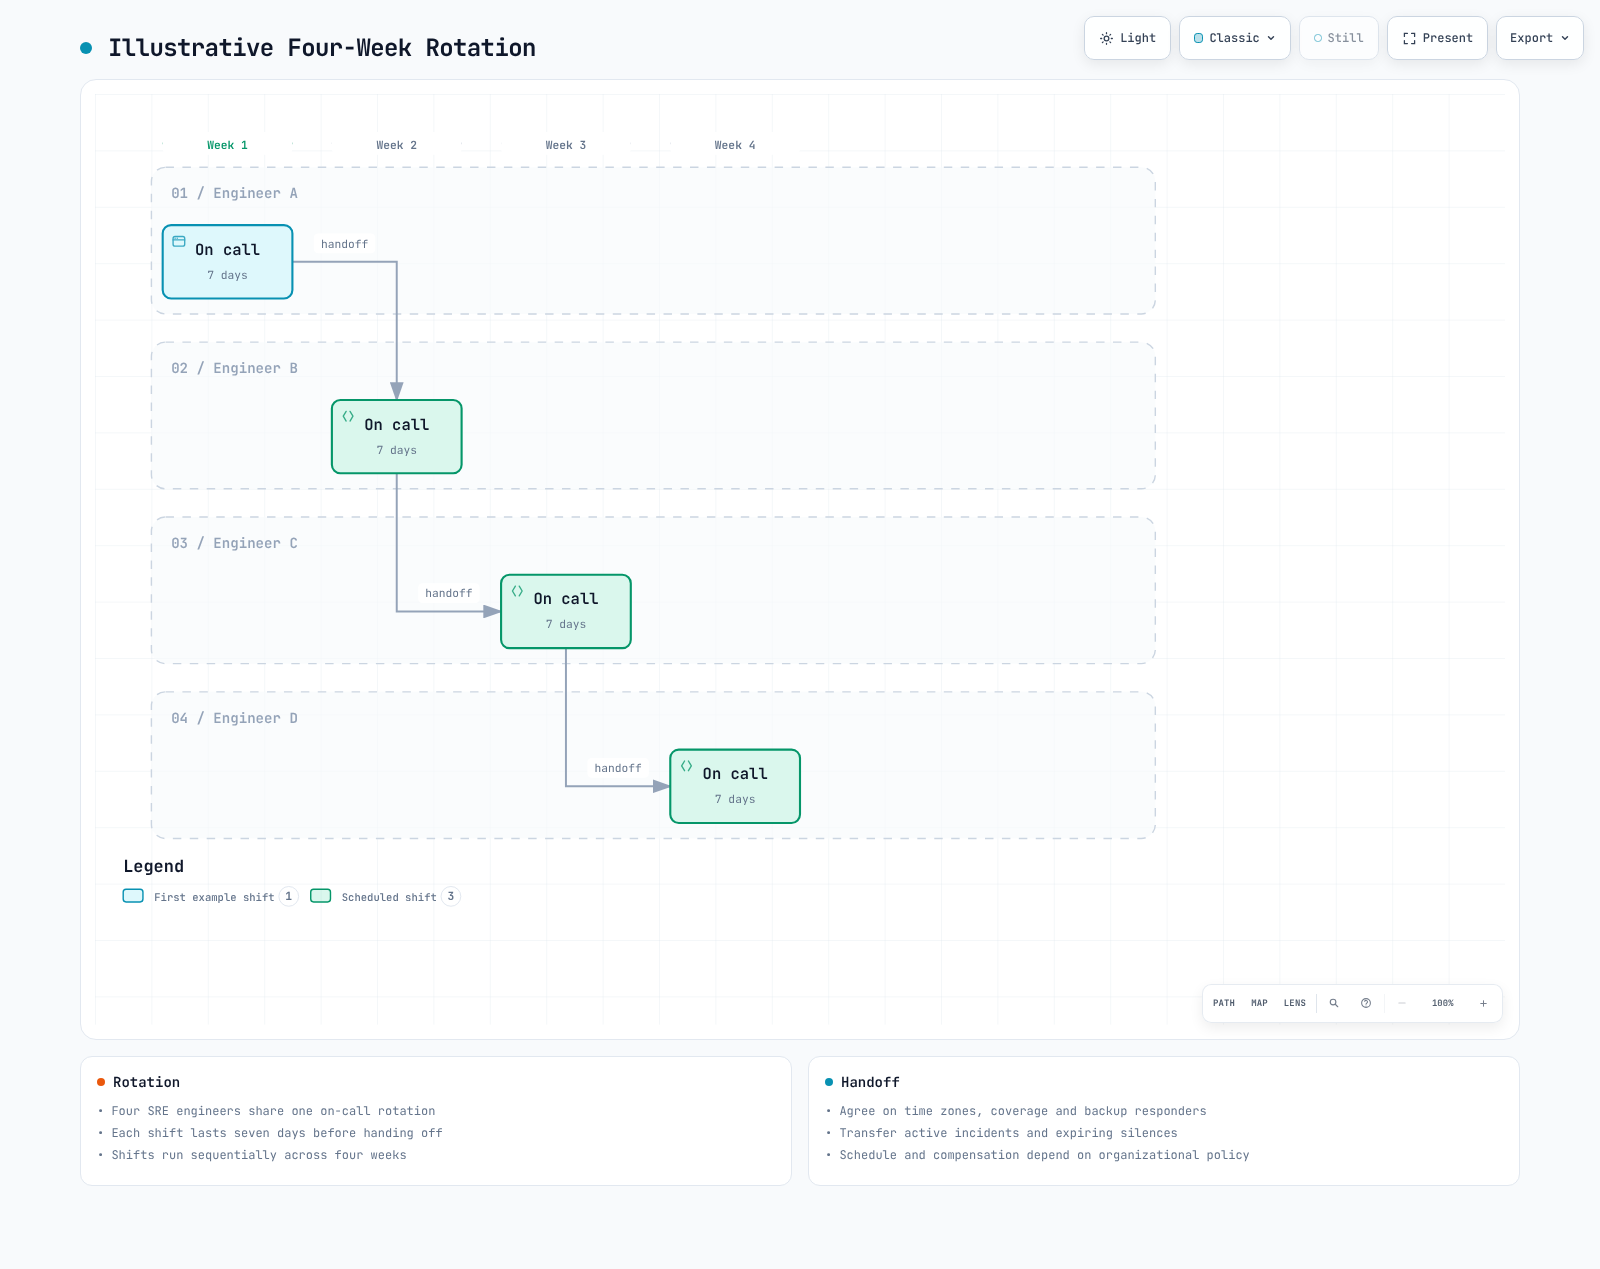
オンコールとは、指定された期間中のシステム問題に責任を持つよう指定された responder を指します。
オンコールのベストプラクティス
- 明確な handoff スケジュール: 毎週または隔週のローテーション
- handoff プロセス: シフト交代時に進行中の問題を引き継ぐ
- backup responder: primary が対応できない場合の backup
- 適切な報酬: オンコール手当または代休
- 燃え尽きの防止: 適切なローテーションサイクル
オンコールツールの要件
- スケジュール管理: calendar integration、シフト管理
- override: 一時的な responder の変更
- エスカレーション: 自動エスカレーション
- モバイル対応: いつでもどこでもアラートを受信
- レポート: オンコール活動の分析
EKS 環境のアラート戦略
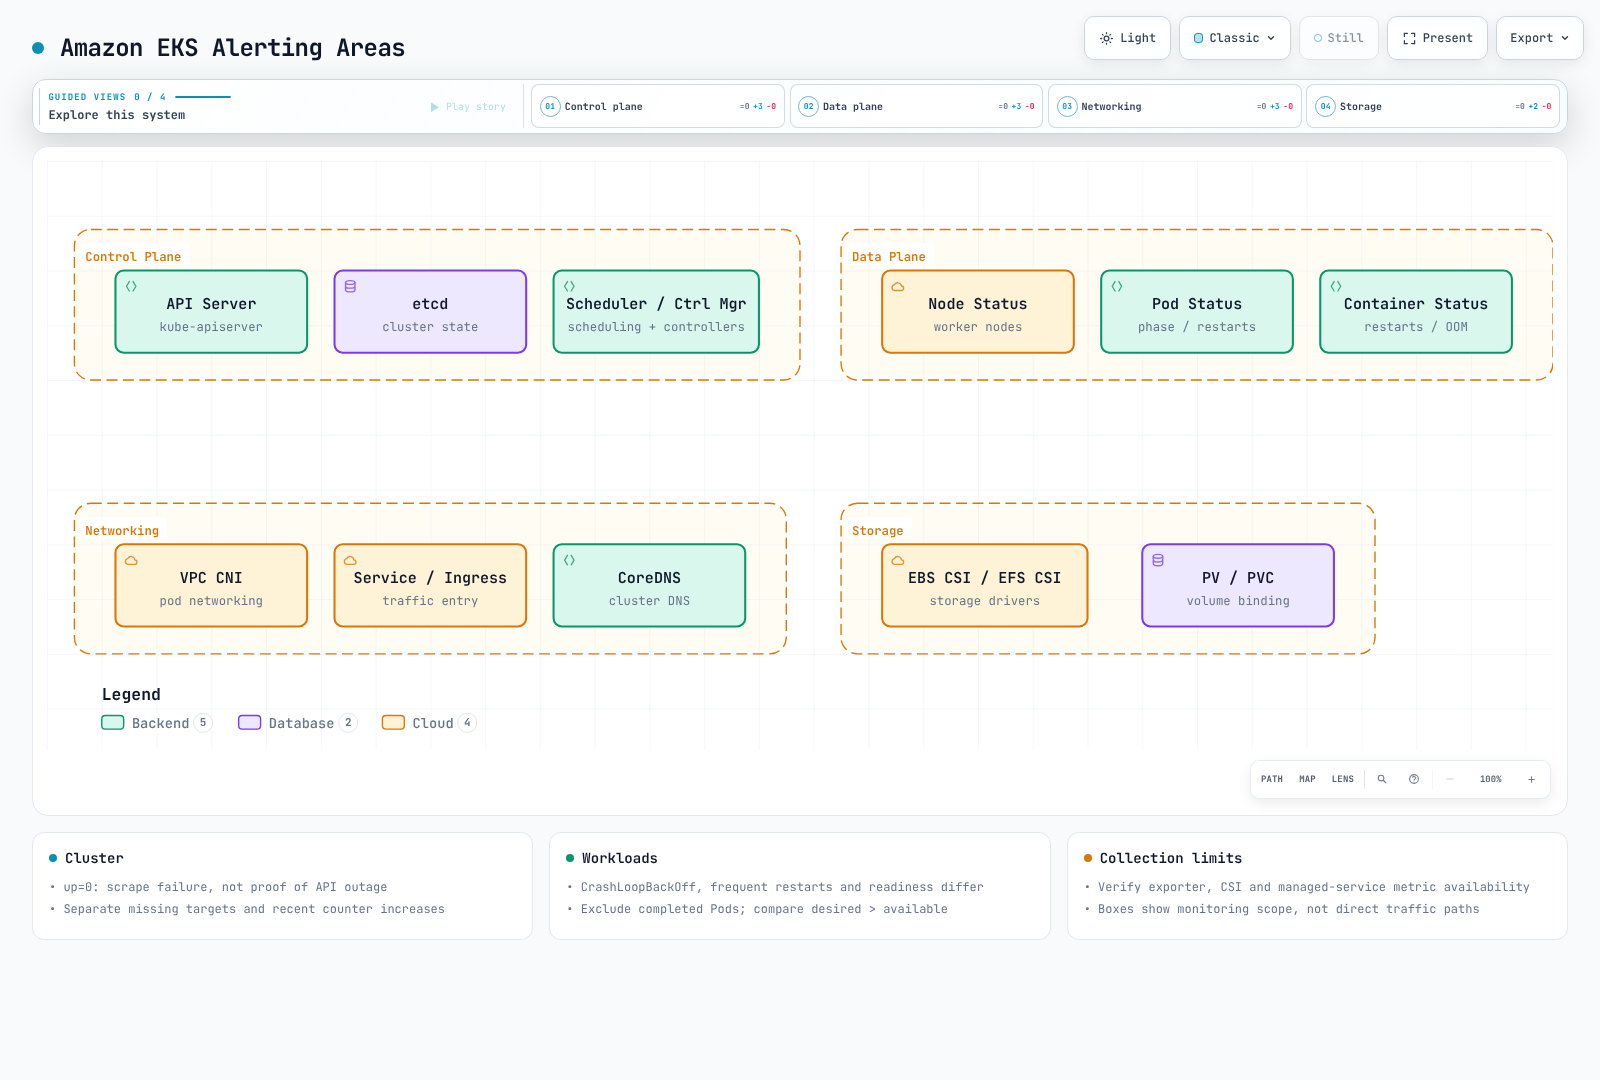
EKS 固有のアラート領域
レイヤー別のアラート戦略
1. Cluster レベルのアラート
job 名をデプロイ済みの target に置き換えてください。up=0 は scrape failure を示すものであり、完全な API outage を示すものではありません。absent rule は 1 つの collection scope を対象としています。multi-cluster 構成では、想定 target inventory と cluster label が必要です。累積する Cluster Autoscaler error counter には increase を使用します。5 分間存在する最近の increase は、error が 5 分間継続して発生したことを意味しません。この rule は Karpenter または EKS Auto Mode に変更なしでは適用できません。
groups:
  - name: eks-cluster
    rules:
      - alert: EKSAPIServerScrapeFailed
        expr: up{job="kubernetes-apiservers"} == 0
        for: 1m
        labels:
          severity: critical
          team: sre
        annotations:
          summary: "Prometheus cannot scrape the configured API server target"
      - alert: EKSAPIServerTargetMissing
        expr: absent(up{job="kubernetes-apiservers"})
        for: 5m
        labels:
          severity: warning
          team: sre
        annotations:
          summary: "No API server target series in this Prometheus"
      - alert: EKSNodeNotReady
        expr: kube_node_status_condition{condition="Ready",status="true"} == 0
        for: 5m
        labels:
          severity: critical
          team: sre
        annotations:
          summary: "Node {{ $labels.node }} is not ready"
      - alert: EKSClusterAutoscalerRecentErrors
        expr: increase(cluster_autoscaler_errors_total[10m]) > 0
        for: 5m
        labels:
          severity: warning
          team: sre
        annotations:
          summary: "Cluster Autoscaler recorded failed loops in the last 10 minutes"
2. Workload レベルのアラート
CrashLoopBackOff series は retry の間に一時的に消失する場合があります。この rule は、直近 5 分間の observation window が 10 分間にわたり存在し続けた後に firing します。これは再発する observation を検出するものであり、継続中の Waiting を検出するものではありません。最後の observation 後も最大 5 分間 active のままになることがあります。native rule test は、短い一時的な事象、再発する retry、復旧を区別します。
groups:
  - name: eks-workloads
    rules:
      - alert: PodCrashLooping
        expr: max_over_time(kube_pod_container_status_waiting_reason{reason="CrashLoopBackOff"}[5m]) >= 1
        for: 10m
        labels:
          severity: warning
          team: app
        annotations:
          summary: "Pod {{ $labels.namespace }}/{{ $labels.pod }} repeatedly observed in CrashLoopBackOff"
      - alert: PodFrequentRestarts
        expr: increase(kube_pod_container_status_restarts_total[15m]) > 3
        for: 5m
        labels:
          severity: warning
          team: app
        annotations:
          summary: "Pod {{ $labels.namespace }}/{{ $labels.pod }} has frequent restarts"
      - alert: PodNotReady
        expr: |
          (kube_pod_status_ready{condition="true"} == 0)
          and on (namespace, pod, uid)
          (kube_pod_status_phase{phase=~"Pending|Running|Unknown"} == 1)
        for: 15m
        labels:
          severity: warning
          team: app
        annotations:
          summary: "Active pod {{ $labels.namespace }}/{{ $labels.pod }} is not ready"
      - alert: DeploymentReplicasMismatch
        expr: |
          kube_deployment_spec_replicas
            > on (namespace, deployment) kube_deployment_status_replicas_available
        for: 10m
        labels:
          severity: warning
          team: app
        annotations:
          summary: "Deployment {{ $labels.namespace }}/{{ $labels.deployment }} has fewer available replicas than desired"
3. Resource レベルのアラート
CFS の例は、経過時間の割合ではなく、throttled periods / total periods を測定します。cAdvisor がこれらの metrics を export していることを確認してください。unlimited memory はゼロまたは非常に大きい値として表示されることがあるため、memory rule は明示的な limit がある container に限定してください。PVC の統計は CSI driver と volume type に依存します。ゼロの分母は除外されていますが、metric が欠落していても健全性を証明するものではありません。
groups:
  - name: eks-resources
    rules:
      - alert: ContainerCPUThrottling
        expr: |
          (
            sum by (namespace, pod, container) (
              rate(container_cpu_cfs_throttled_periods_total{container!="",container!="POD"}[5m]))
            / sum by (namespace, pod, container) (
              rate(container_cpu_cfs_periods_total{container!="",container!="POD"}[5m]))
          ) > 0.25
          and sum by (namespace, pod, container) (
            rate(container_cpu_cfs_periods_total{container!="",container!="POD"}[5m])) > 0
        for: 5m
        labels:
          severity: warning
          team: app
        annotations:
          summary: "More than 25% of CFS periods throttled for {{ $labels.pod }}/{{ $labels.container }}"
      - alert: ContainerMemoryNearLimit
        expr: |
          (
            container_memory_working_set_bytes{container!="",container!="POD"}
            / container_spec_memory_limit_bytes{container!="",container!="POD"}
          ) > 0.9
          and container_spec_memory_limit_bytes{container!="",container!="POD"} > 0
        for: 5m
        labels:
          severity: warning
          team: app
        annotations:
          summary: "Container {{ $labels.pod }}/{{ $labels.container }} memory is near its reported limit"
      - alert: PVCAlmostFull
        expr: |
          (kubelet_volume_stats_used_bytes / kubelet_volume_stats_capacity_bytes > 0.85)
          and kubelet_volume_stats_capacity_bytes > 0
        for: 5m
        labels:
          severity: warning
          team: sre
        annotations:
          summary: "PVC {{ $labels.namespace }}/{{ $labels.persistentvolumeclaim }} is almost full"
AWS Service Integration のアラート
EKS 1.28+ は、選択された control-plane metrics を AWS/EKS で提供します。ただし、すべての internal component を scrape 用に公開するわけではありません。authentication error を調査するには、control-plane log を別途有効化してください。collection health、API request failure、external probe を使用して可用性を評価します。
| AWS Service | 監視項目 | アラートツール |
|---|---|---|
| EKS Control Plane | API Server の可用性、authentication error | CloudWatch |
| EC2 (Nodes) | Instance status、system check | CloudWatch |
| EBS | Volume status、IOPS 使用率 | CloudWatch |
| EFS | Throughput、connection 数 | CloudWatch |
| ALB / NLB | ALB HTTP request/error/response time、NLB flow/TCP reset/target health | CloudWatch: 製品固有の metrics を使用 |
| VPC / NAT Gateway | NAT metrics、別途有効化された Flow Logs の accepted/rejected record | CloudWatch metrics/Logs。Flow Logs は alarm engine ではありません |
ソリューションの比較
主なアラートソリューションの比較表
| 製品 | 役割と運用上の制約 |
|---|---|
| Alertmanager | オープンソースの grouping、routing、inhibition、reminder。hosting と運用が必要です。オンコール schedule や確認応答ベースの escalation はありません |
| CloudWatch Alarms | AWS metrics/対応 query を評価し、state を変更して設定済み action を呼び出します。schedule は別途必要です |
| Grafana OnCall OSS | 2026-03-24 に archive 済み。新規の本番 deployment のデフォルト選択肢ではありません |
| Grafana Cloud IRM / PagerDuty | オンコール/エスカレーションの候補。現在の plan、channel、region、contract を確認してください |
| Opsgenie | 2025-06-04 に販売終了。support および service の終了は 2027-04-05 を予定しています。既存ユーザーには migration plan が必要です |
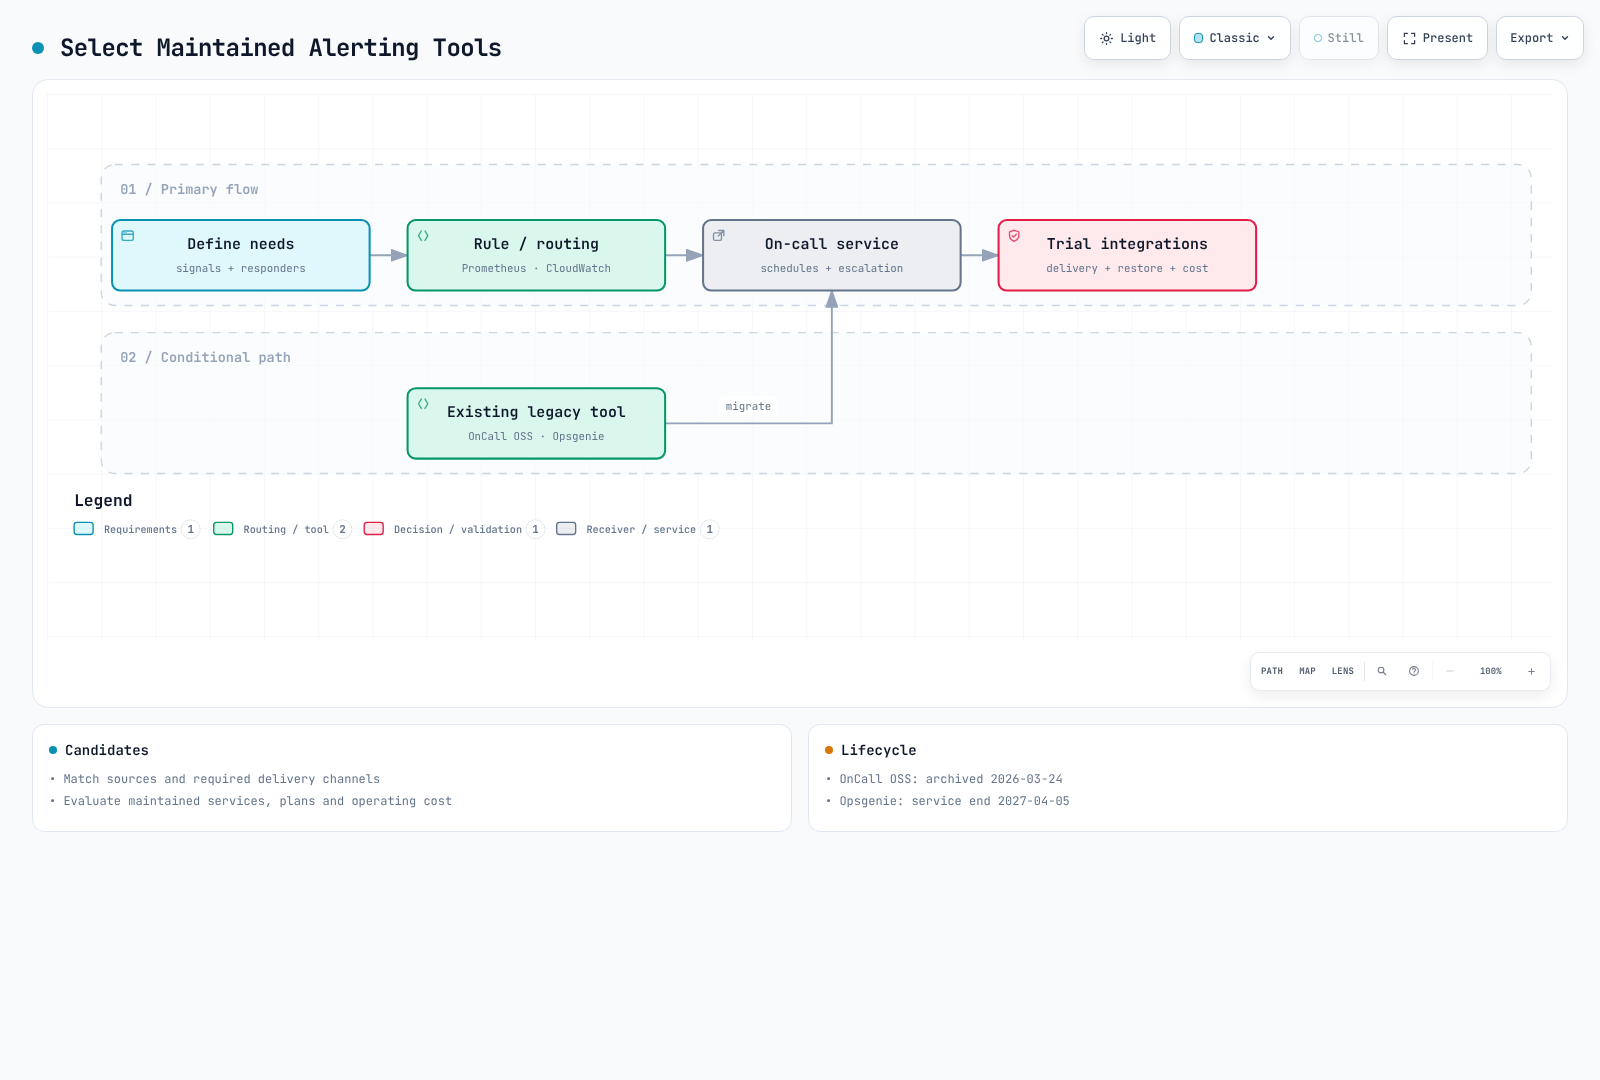
ソリューション選択ガイド
状況別の推奨ソリューション
- Prometheus 中心: Alertmanager を grouping/routing に使用し、必要な channel を接続します。
- AWS metric 中心: SNS または対応する incident integration とともに CloudWatch Alarms を評価します。
- 24 時間対応: 人員配置、backup、time zone、確認応答、escalation、コストに基づいて、保守されたオンコールサービスを選択します。
- 既存の Grafana OnCall OSS/Opsgenie: 機能、履歴、schedule、integration の migration を検証します。
ハイブリッドアプローチ
ソリューションは組み合わせることができます。CloudWatch が自動的に Alertmanager へ直接送信することはありません。この例では、SNS/オンコールサービスへの対応 integration を使用します。Alertmanager を経由する routing には、別途設計された adapter、authentication、重複/解決の処理が必要です。
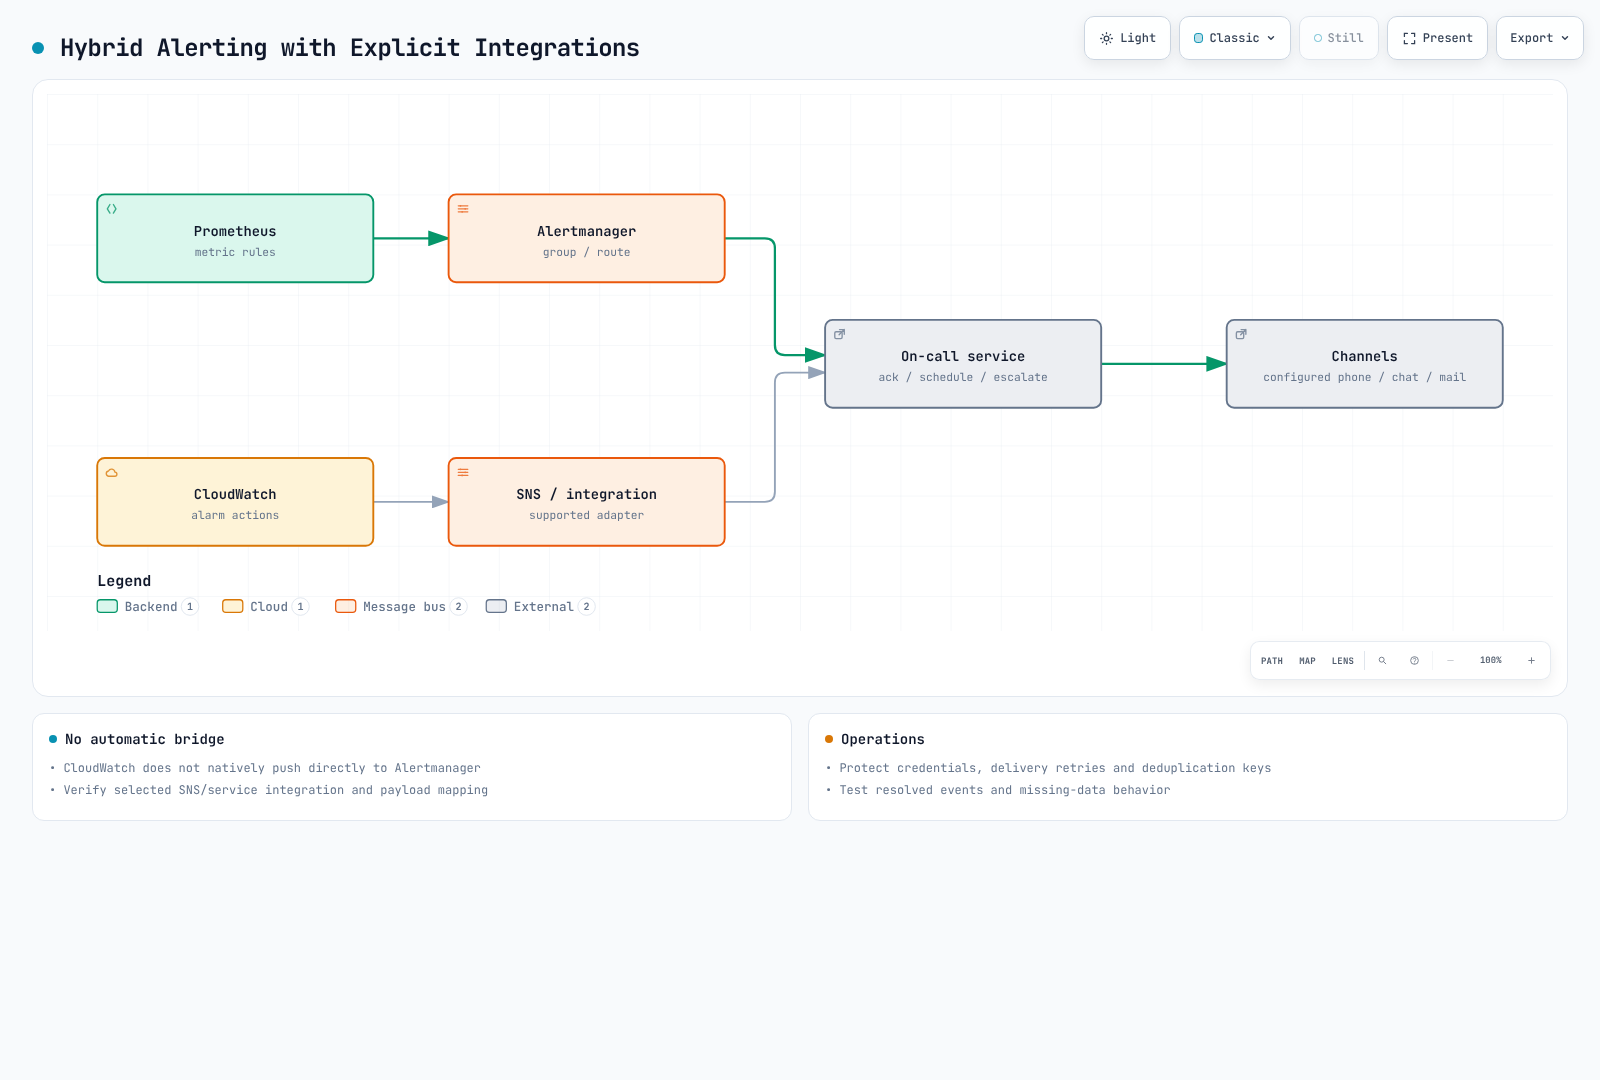
アーキテクチャ例:
- Prometheus + Alertmanager: metric collection と primary alert processing
- CloudWatch: AWS service metric collection
- 保守されたオンコールサービス: オンコール管理とエスカレーション
- Slack: リアルタイムアラートとコラボレーション
次のステップ
このセクションでは、アラートの基本的な概念と戦略を扱いました。各ソリューションの詳細な設定方法については、以下のドキュメントを参照してください。
- Prometheus Alertmanager: オープンソースのアラート管理
- CloudWatch Alarms: AWS ネイティブのアラート
- Grafana OnCall: 既存 installation のレビューと migration に関する考慮事項