オブザーバビリティクイズ
最終更新: October 12, 2026
バージョン: Kubernetes 1.32–1.37 をサポートする Istio 1.31。 EKS および Kiali の互換性制限については、インストールとダッシュボードの章を参照してください。
このクイズでは、設定済みの sidecar/waypoint テレメトリを扱います。各解説例は独立しており、記載されたバックエンド、namespace、権限、トラフィックが存在することを前提とします。YAML/API/クエリの確認は、production または live-cluster テストではありません。ztunnel L4、native sidecar、HA Deployment には、それぞれ固有の収集設定が必要です。
選択式問題 (1-5)
問題 1: Prometheus メトリクス
Istio 標準のサービスメトリクス名/ファミリーではないものはどれですか?
A. istio_requests_total (総リクエスト数)
B. istio_request_duration_milliseconds (リクエストレイテンシ)
C. istio_request_bytes (リクエストサイズ)
D. istio_pod_cpu_usage (Pod CPU 使用量)
回答を表示
回答: D
Istio 標準サービスメトリクスはトラフィックを記述します。Envoy は内部プロキシ統計も公開します。Prometheus は kubelet/cAdvisor(または runtime のリソースパイプライン)から container CPU 使用量を取得します。Metrics Server は autoscaling と kubectl top のためにリソースメトリクスを提供します。kube-state-metrics は object の状態と設定済みの requests/limits を公開しますが、計測された CPU 消費量は公開しません。
解説:
Istio により収集されるメトリクス:
- istio_requests_total (A - O)
# Request rate by service (per second)
sum(rate(istio_requests_total{reporter="destination"}[5m])) by (destination_service_name, destination_service_namespace)- istio_request_duration_milliseconds (B - O)
# P95 latency
histogram_quantile(0.95,
  sum(rate(istio_request_duration_milliseconds_bucket{reporter="destination"}[5m])) by (le)
)- istio_request_bytes (C - O)
# Request body byte rate (bytes/second), not mean request size
sum(rate(istio_request_bytes_sum{reporter="destination"}[5m])) by (destination_service_name, destination_service_namespace)- istio_pod_cpu_usage (D - X)
- これは Istio メトリクスではありません
- Kubernetes メトリクス:
container_cpu_usage_seconds_total - kubelet/cAdvisor を scrape します。kube-state-metrics は使用量と設定済み limits を比較する際に有用です
Istio メトリクスのカテゴリ:
| カテゴリ | メトリクス例 | 説明 |
|---|---|---|
| リクエスト | istio_requests_total | リクエスト数、レスポンスコード |
| 期間 | istio_request_duration_milliseconds | レイテンシ分布 |
| サイズ | istio_request_bytes, istio_response_bytes | トラフィックサイズ |
| TCP | istio_tcp_connections_opened_total | TCP 接続 |
Golden Signals の例:
# 1. Latency
histogram_quantile(0.95,
  sum(rate(
    istio_request_duration_milliseconds_bucket{reporter="destination",
      destination_service_name="reviews", destination_service_namespace="default"
    }[5m]
  )) by (le)
)

# 2. Traffic
sum(rate(
  istio_requests_total{reporter="destination",
    destination_service_name="reviews", destination_service_namespace="default"
  }[5m]
))

# 3. Errors (error rate)
sum(rate(
  istio_requests_total{reporter="destination",
    destination_service_name="reviews", destination_service_namespace="default",
    response_code=~"5.."
  }[5m]
))
/
sum(rate(
  istio_requests_total{reporter="destination",
    destination_service_name="reviews", destination_service_namespace="default"
  }[5m]
))

# 4. Saturation - Uses Kubernetes metrics
sum(rate(
  container_cpu_usage_seconds_total{
    namespace="default", container="istio-proxy", pod=~"reviews-.*"
  }[5m]
))
メトリクスの確認:
# Check metrics via Envoy Admin API
istioctl x envoy-stats <pod-name>.default --output prom

# Check in Prometheus
kubectl port-forward -n istio-system svc/prometheus 9090:9090
# Query at http://localhost:9090
参照:
問題 2: 分散トレーシング
動作する tracing provider/backend がある場合、サービス呼び出しをまたいで proxy span を結合するために必要なアプリケーションの責務はどれですか?
A. アプリケーションが trace ID を生成する必要がある
B. アプリケーションが HTTP header を伝播する必要がある
C. すべての Service に Jaeger client をインストールする必要がある
D. Envoy がすべてを自動処理する
回答を表示
回答: B
設定済みの proxy は span と trace ID を生成できますが、アプリケーションは outbound 呼び出しに trace context を伝播する必要があります。SDK は active context を inject する必要があるため、trace ID は同じまま child span ID が変わる場合があります。独自の span を持たない transparent application は、選択された propagation header を転送できます。
解説:
分散トレーシングの仕組み:
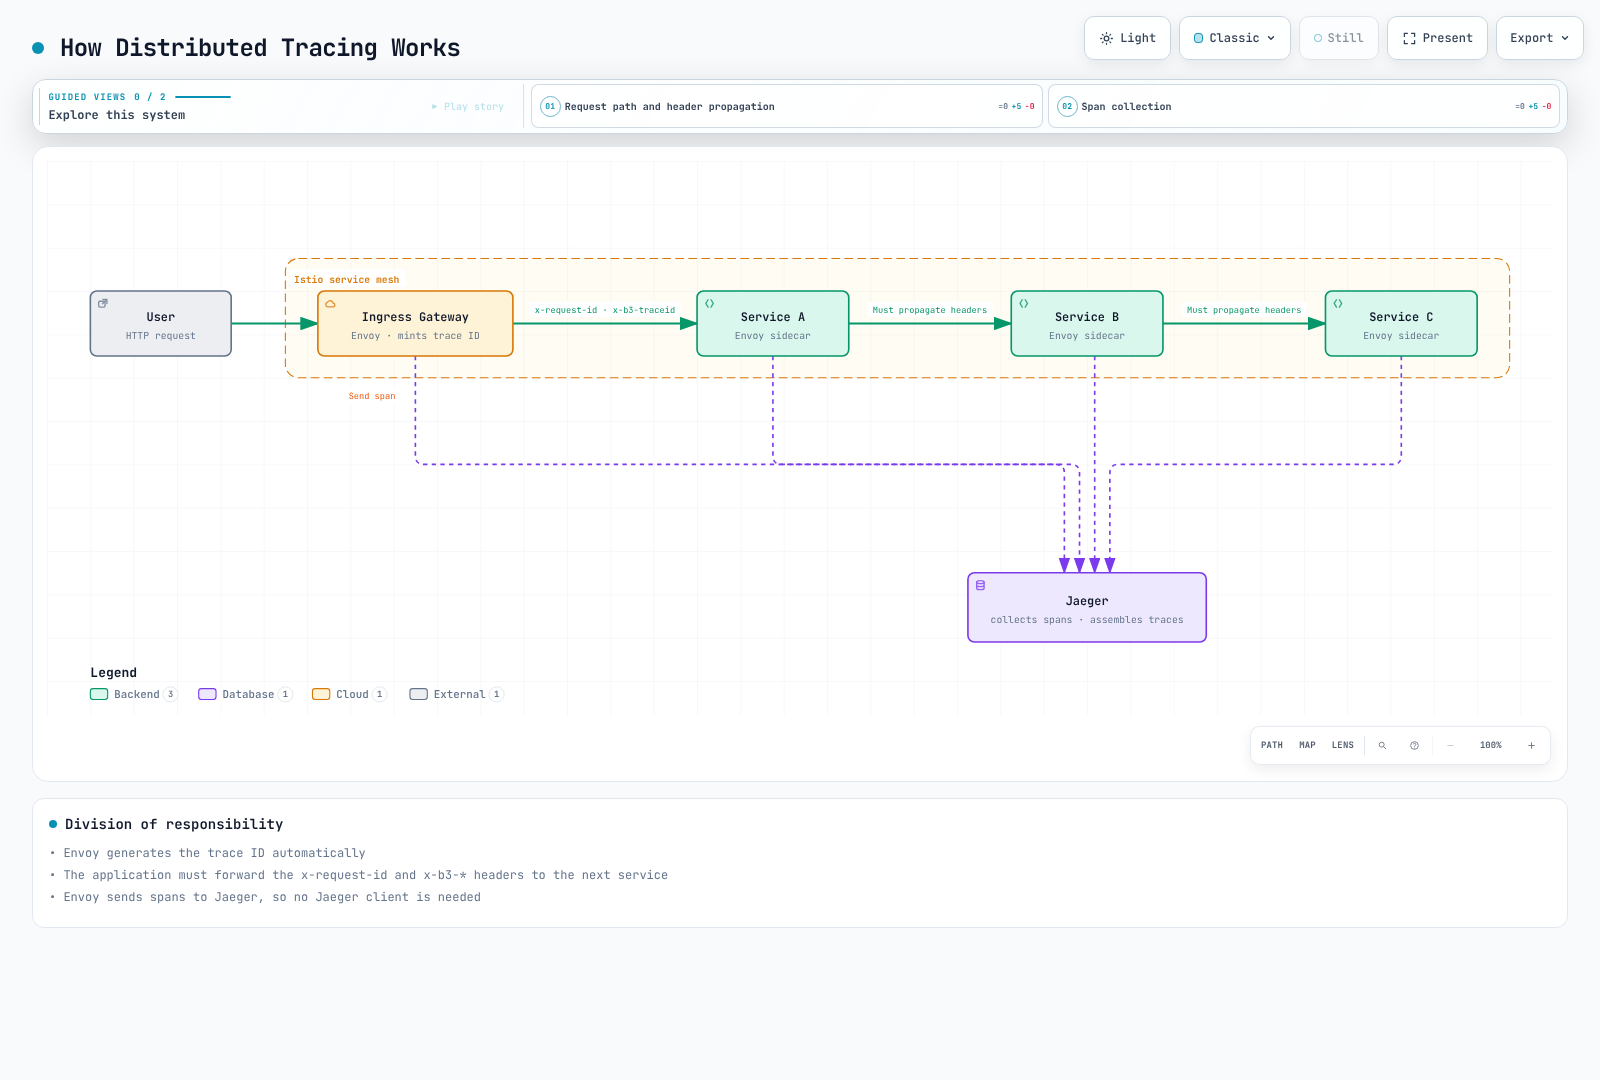
この図は、設定済み Jaeger backend への B3 propagation を示しています。W3C propagation と中間 OpenTelemetry Collector もサポートされています。instrument 済みアプリケーションは、すべての header を変更せずにコピーするのではなく、active span context を inject します。
伝播する HTTP Header:
W3C: traceparent, tracestate
B3 (if configured): b3 OR x-b3-traceid, x-b3-spanid, x-b3-parentspanid, x-b3-sampled
Istio correlation: x-request-id
B3 debug flag: x-b3-flags (do not force debug sampling on ordinary traffic)
アプリケーションコード例:
# Python Flask example
from flask import Flask, request
import requests

app = Flask(__name__)

@app.route('/api/users')
def get_users():
    # 1. Extract received headers
    headers = {}
    for header in ['x-request-id', 'traceparent', 'tracestate', 'b3', 'x-b3-traceid', 'x-b3-spanid',
                   'x-b3-parentspanid', 'x-b3-sampled', 'x-b3-flags']:
        if header in request.headers:
            headers[header] = request.headers[header]

    # 2. Propagate headers when calling next service
    response = requests.get(
        'http://user-service/users',
        headers=headers, timeout=3  # Selected propagation format
    )

    response.raise_for_status()
return response.json()// Node.js Express example
const express = require('express');
const axios = require('axios');
const app = express();
app.get('/api/users', async (req, res) => {
// 1. Extract received headers
const tracingHeaders = {};
['x-request-id', 'traceparent', 'tracestate', 'b3', 'x-b3-traceid', 'x-b3-spanid',
'x-b3-parentspanid', 'x-b3-sampled', 'x-b3-flags'].forEach(header => {
if (req.headers[header]) {
tracingHeaders[header] = req.headers[header];
}
});
// 2. Propagate headers when calling next service
try {
const response = await axios.get('http://user-service/users', {
headers: tracingHeaders, timeout: 3000
});
res.json(response.data);
} catch (error) {
res.status(502).json({error: 'Downstream request failed'});
}
});各選択肢の分析:
- A (X): Envoy が trace ID を自動生成します
- B (O): アプリケーションは HTTP header を伝播する必要があります(必須)
- C (X): Jaeger client は不要です。Envoy が Span を送信します
- D (X): Envoy は Span を作成/送信しますが、header propagation はアプリケーションの責務です
Sampling 設定:
これは tracing の章の otel-tracing provider を前提としています。1.0 は 100% ではなく 1% を意味します。provider/exporter の設定と context propagation は別個の要件です。
apiVersion: telemetry.istio.io/v1
kind: Telemetry
metadata:
  name: tracing-sample
  namespace: default
spec:
  tracing:
  - providers:
    - name: otel-tracing
    randomSamplingPercentage: 1.0
Jaeger へのアクセス:
kubectl port-forward -n observability svc/jaeger-query 16686:16686参照:
問題 3: Kiali の可視化
Kiali により提供されない機能はどれですか?
A. Service topology の可視化
B. Traffic flow の分析
C. Automatic Canary Deployment の実行
D. Istio 設定の検証
回答を表示
回答: C
Kiali は観測および分析ツールであり、Deployment の実行は Argo Rollouts のようなツールが担当します。
解説:
Kiali の主な機能:
1. Service Topology の可視化 (A - O)
# Open Kiali dashboard
istioctl dashboard kiali

# Features:
# - Real-time service connection display
# - Traffic flow direction display
# - Service status (healthy/error)
# - Response time display
Graph View の例:
Frontend → Backend → Database
   ↓
External API

Color codes:
- Green: Normal
- Red: Error
- Gray: No traffic
2. Traffic Flow の分析 (B - O)
Kiali は以下を表示します:
- リクエスト数 (RPS)
- エラー率 (%)
- P50/P95/P99 レイテンシ
- TCP 接続数
3. Automatic Canary Deployment の実行 (C - X)
- Kiali はトラフィックを表示でき、権限があれば Istio 設定を編集/traffic wizard を使用できます
- 自動化された progressive-delivery controller の代替にはなりません
- Deployment の実行: Argo Rollouts、Flagger
4. Istio 設定の検証 (D - O)
- VirtualService: 未定義の subset (
KIA1107)。 - DestinationRule: 重複する host/subset 定義 (
KIA0201)。 - AuthorizationPolicy: 参照された namespace が見つからない (
KIA0101)、または principal が検出済み workload ServiceAccount に関連付けられていない (KIA0106)。
チェックは Kiali の version、discovery scope、アクセスに依存します。実際の code/message と effective proxy policy を確認してください。Kiali は任意の policy が競合すること、またはすべての certificate と runtime route が動作することを証明しません。
Kiali のインストール:
固定された operator、認証、および現在の互換性制限については、ダッシュボードの章に従ってください。Kiali は個別にインストールします。sample addon は demo であり、backend/RBAC 設定なしの Helm install は production 構成ではありません。
Kiali のメインメニュー:
1. Overview: Service summary by Namespace
2. Graph: Service topology
3. Applications: Application list
4. Workloads: Deployment, StatefulSet, etc.
5. Services: Kubernetes Service
6. Istio Config: VirtualService, DestinationRule, etc.
Kiali と他のツール:
| ツール | 役割 | 自動 progressive delivery |
|---|---|---|
| Kiali | 可視化、分析、検証 | いいえ |
| Argo Rollouts | Progressive Delivery | はい |
| Flagger | Automatic Canary deployment | はい |
| Grafana | メトリクスダッシュボード | いいえ |
| Jaeger | 分散トレーシング | いいえ |
実践的な使用例:
# 1. Check service topology in Kiali
istioctl dashboard kiali

# 2. Detect anomalies in Graph view
#    - reviews service error rate 5%
#    - productpage → reviews latency increase

# 3. Check details in Workload view
#    - Check reviews-v2 Pod logs
#    - Check Envoy metrics

# 4. Validate configuration in Istio Config view
#    - Found typo in VirtualService
#    - Fix and redeploy
参照:
問題 4: Access Log の設定
Istio で JSON 形式の Access Log 出力を設定するにはどうしますか?
A. IstioOperator で meshConfig.accessLogEncoding を JSON に設定する
B. Envoy ConfigMap を直接変更する
C. 各 Pod に annotation を追加する
D. Prometheus query で JSON に変換する
回答を表示
回答: A
A は有効な MeshConfig の方法です。istioctl install -f 入力で logging を有効にして accessLogEncoding: JSON を使用します。これは cluster 内の operator resource ではありません。logging の章で説明した custom envoyFileAccessLog.logFormat.labels provider も、別のサポートされる方法です。
解説:
JSON 形式の Access Log 設定:
apiVersion: install.istio.io/v1alpha1
kind: IstioOperator
spec:
  meshConfig:
    # Enable Access Log
    accessLogFile: /dev/stdout

    # Output in JSON format
    accessLogEncoding: JSON

    # Define custom JSON format
    accessLogFormat: |
      {
        "log_type": "access",
        "start_time": "%START_TIME%",
        "method": "%REQ(:METHOD)%",
        "path": "%REQ_WITHOUT_QUERY(X-ENVOY-ORIGINAL-PATH?:PATH)%",
        "protocol": "%PROTOCOL%",
        "response_code": "%RESPONSE_CODE%",
        "response_flags": "%RESPONSE_FLAGS%",
        "bytes_received": "%BYTES_RECEIVED%",
        "bytes_sent": "%BYTES_SENT%",
        "duration": "%DURATION%",
        "upstream_service_time": "%RESP(X-ENVOY-UPSTREAM-SERVICE-TIME)%",
        "x_forwarded_for": "%REQ(X-FORWARDED-FOR)%",
        "user_agent": "%REQ(USER-AGENT)%",
        "request_id": "%REQ(X-REQUEST-ID)%",
        "authority": "%REQ(:AUTHORITY)%",
        "upstream_host": "%UPSTREAM_HOST%",
        "upstream_cluster": "%UPSTREAM_CLUSTER%",
        "upstream_local_address": "%UPSTREAM_LOCAL_ADDRESS%",
        "downstream_local_address": "%DOWNSTREAM_LOCAL_ADDRESS%",
        "downstream_remote_address": "%DOWNSTREAM_REMOTE_ADDRESS%",
        "requested_server_name": "%REQUESTED_SERVER_NAME%",
        "route_name": "%ROUTE_NAME%"
      }
出力例:
{
  "log_type": "access",
  "start_time": "2025-01-20T10:30:00.123Z",
  "method": "GET",
  "path": "/api/users",
  "protocol": "HTTP/1.1",
  "response_code": 200,
  "response_flags": "-",
  "bytes_received": 0,
  "bytes_sent": 1234,
  "duration": 42,
  "upstream_service_time": "40",
  "x_forwarded_for": "192.168.1.100",
  "user_agent": "Mozilla/5.0",
  "request_id": "abc-123-def",
  "authority": "example.com",
  "upstream_host": "10.0.1.20:8080",
  "upstream_cluster": "outbound|8080||backend.default.svc.cluster.local",
  "upstream_local_address": "10.0.1.10:54321",
  "downstream_local_address": "10.0.1.10:8080",
  "downstream_remote_address": "10.0.1.5:12345",
  "requested_server_name": "-",
  "route_name": "default"
}
Namespace ごとの設定:
この代替方法では、まず logging の章にあるとおり mesh-json を定義します。Telemetry は provider/scope を選択しますが、それ自体が provider の形式を変更するわけではありません。
apiVersion: telemetry.istio.io/v1
kind: Telemetry
metadata:
  name: access-logging
  namespace: production
spec:
  accessLogging:
  - providers:
    - name: mesh-json
    # Select the already-defined JSON provider
Envoy 形式変数:
# Key variables:
%START_TIME%: Request start time
%REQ(HEADER)%: Request header
%RESP(HEADER)%: Response header
%RESPONSE_CODE%: HTTP response code
%DURATION%: Total duration (ms)
%BYTES_RECEIVED%: Bytes received
%BYTES_SENT%: Bytes sent
%UPSTREAM_HOST%: Upstream server address
%DOWNSTREAM_REMOTE_ADDRESS%: Client address
CloudWatch Logs 統合:
これは、input tag の一致、CRI/JSON parsing、IAM credentials、log mount を備えた、すでに Deployment 済みの Fluent Bit agent 向けの出力 fragment にすぎません。ConfigMap 単体では log を収集しません。EKS Fargate にはサポート対象の log-router 設定が必要です。
apiVersion: v1
kind: ConfigMap
metadata:
  name: fluent-bit-config
  namespace: istio-system
data:
  output.conf: |
    [OUTPUT]
        Name cloudwatch_logs
        Match *
        region us-east-1
        log_group_name /aws/eks/istio/access-logs
        log_stream_prefix istio-
        auto_create_group true
Log の確認:
# Check Pod's Access Log
kubectl logs <pod-name> -c istio-proxy

# Real-time monitoring
kubectl logs -f <pod-name> -c istio-proxy | jq -R 'fromjson?'

# Filter specific response codes
kubectl logs <pod-name> -c istio-proxy | \
  jq -R 'fromjson? | select((.response_code | tonumber?) == 500)'
TEXT 形式と JSON 形式の比較:
| 項目 | TEXT | JSON |
|---|---|---|
| 可読性 | 高い (人間) | 低い (人間) |
| Parsing | 困難 | 容易 (machine) |
| サイズ | 小さい | 大きい |
| 構造 | 非構造化 | 構造化 |
| クエリ | 困難 | 容易 (jq など) |
TEXT 形式の例:
[2025-01-20T10:30:00.123Z] "GET /api/users HTTP/1.1" 200 - "-" "-" 0 1234 42 40 "192.168.1.100" "Mozilla/5.0" "abc-123-def" "example.com" "10.0.1.20:8080" outbound|8080||backend.default.svc.cluster.local 10.0.1.10:54321 10.0.1.10:8080 10.0.1.5:12345 - default参照:
問題 5: Grafana ダッシュボード
Istio が公開している Grafana ダッシュボードセットに含まれないダッシュボードはどれですか?
A. Istio Service Dashboard
B. Istio Workload Dashboard
C. Istio Performance Dashboard
D. Istio Cost Dashboard
回答を表示
回答: D
D. Istio は traffic/control-plane ダッシュボードを公開していますが、Grafana 自体は別の addon です。Istio をインストールしても、これらのダッシュボードは自動的にはインストールされません。
解説:
1.31 catalog には Service7636、Workload7630、Mesh7639、Performance11829、Control Plane7645、Wasm13277、Ztunnel21306 が含まれます。Performance は resource/data usage に焦点を当てています。xDS/webhook panel は主に Control Plane に属します。Mesh にはグローバルなトラフィックと component version が含まれますが、以前ここに列挙されたすべての latency panel は含まれません。インストール済み Istio release に一致する revision を選択してください。
Cost は istio_requests_total に GB transfer price を掛けて計算できません。request は byte ではなく、source_cluster/destination_cluster は Availability Zone ではなく cluster を識別します。Proxy memory は usage であり請求額ではありません。Network costing には課金対象 byte の計測値と、実際の source/destination location/service rule が必要です。Resource cost allocation には node price、時間、明示的な allocation model が必要です。固定の式を主張する代わりに、AWS billing/CUR data と該当する pricing で見積もりを照合してください。
検証済み catalog revision と完全な custom JSON/provisioning の例については、ダッシュボードの章を使用してください。ConfigMap と label だけでは、dashboard loader をインストールしたり datasource input を解決したりしません。
記述式問題 (6-10)
問題 6: Golden Signals の監視
Istio と Prometheus を使用して Google SRE の Golden Signals(Latency、Traffic、Errors、Saturation)を監視する方法を説明してください。各 signal の Prometheus query と alerting rule を含めてください。
回答を表示
サービス hop ごとの計算には 1 つの reporter を使用し、Service namespace(該当する場合は cluster も)を維持してください。destination メトリクスは Service が受信した request を計測します。到達しなかった upstream failure には source メトリクスが必要です。HTTP5xx は error 定義の一つにすぎません。gRPC failure には grpc_response_status と application 固有の SLI rule が必要です。以下の latency は millisecond、rate は秒あたりです:
histogram_quantile(0.95, sum by (destination_service_name, destination_service_namespace, le) (rate(istio_request_duration_milliseconds_bucket{reporter="destination"}[5m])))

histogram_quantile(0.99, sum by (destination_service_name, destination_service_namespace, le) (rate(istio_request_duration_milliseconds_bucket{reporter="destination"}[5m])))

sum by (destination_service_name, destination_service_namespace) (rate(istio_requests_total{reporter="destination"}[5m]))

sum by (destination_service_name, destination_service_namespace) (rate(istio_requests_total{reporter="destination",response_code=~"5.."}[5m])) / sum by (destination_service_name, destination_service_namespace) (rate(istio_requests_total{reporter="destination"}[5m]))
single-cluster の classic sidecar Deployment では、usage/limit ratio に kubelet/cAdvisor と kube-state-metrics が必要です。存在しない limit と zero limit を除外してください。native sidecar では、init-container resource series に宣言済み limit が報告される場合があります。これらの式を使用する前に、実際の metric family を確認してください:
sum by (namespace, pod, container) (rate(container_cpu_usage_seconds_total{container="istio-proxy"}[5m])) / on (namespace, pod, container) (max by (namespace, pod, container) (kube_pod_container_resource_limits{container="istio-proxy",resource="cpu",unit="core"}) > 0)

max by (namespace, pod, container) (container_memory_working_set_bytes{container="istio-proxy"}) / on (namespace, pod, container) (max by (namespace, pod, container) (kube_pod_container_resource_limits{container="istio-proxy",resource="memory",unit="byte"}) > 0)

envoy_cluster_upstream_cx_active
envoy_cluster_upstream_rq_pending_active
envoy_cluster_circuit_breakers_default_cx_open
_cx_open metric は 0/1 state gauge です。active connection をこれで割って utilization を求めることはできません。capacity ratio が必要な場合は、設定済み circuit-breaker threshold を確認してください。division 前の CPU rate は core、memory working set は byte です。method の内訳には、まず bounded request_method Telemetry label を追加する必要があります。
次の PrometheusRule は、インストール済み Prometheus Operator が選択する必要があります。threshold と comparison window は例示です。traffic seasonality、no-data、scrape failure、minimum volume condition は環境固有の対応が必要です。過去 1 時間の window は学習済みの normal baseline ではありません。
apiVersion: monitoring.coreos.com/v1
kind: PrometheusRule
metadata:
  name: istio-golden-signals
  namespace: monitoring
spec:
  groups:
  - name: golden-signals
    rules:
    - alert: HighLatency
      expr: histogram_quantile(0.95, sum by (destination_service_name, destination_service_namespace,
        le) (rate(istio_request_duration_milliseconds_bucket{reporter="destination"}[5m]))) > 500
      for: 5m
      labels:
        severity: warning
      annotations:
        summary: P95 request duration exceeds500ms
    - alert: TrafficSpike
      expr: sum by (destination_service_name, destination_service_namespace) (rate(istio_requests_total{reporter="destination"}[5m]))
        > 2 * sum by (destination_service_name, destination_service_namespace) (rate(istio_requests_total{reporter="destination"}[1h]
        offset 1h))
      for: 5m
      labels:
        severity: warning
      annotations:
        summary: Traffic exceeds the previous comparison window
    - alert: HighErrorRate
      expr: sum by (destination_service_name, destination_service_namespace) (rate(istio_requests_total{reporter="destination",response_code=~"5.."}[5m]))
        / sum by (destination_service_name, destination_service_namespace) (rate(istio_requests_total{reporter="destination"}[5m]))
        > 0.01
      for: 5m
      labels:
        severity: warning
      annotations:
        summary: HTTP5xx fraction exceeds1%
    - alert: HighEnvoyCPU
      expr: sum by (namespace, pod, container) (rate(container_cpu_usage_seconds_total{container="istio-proxy"}[5m]))
        / on (namespace, pod, container) (max by (namespace, pod, container) (kube_pod_container_resource_limits{container="istio-proxy",resource="cpu",unit="core"})
        > 0) > 0.8
      for: 5m
      labels:
        severity: warning
      annotations:
        summary: Proxy CPU consumption exceeds80% of its configured limit
    - alert: HighEnvoyMemory
      expr: max by (namespace, pod, container) (container_memory_working_set_bytes{container="istio-proxy"})
        / on (namespace, pod, container) (max by (namespace, pod, container) (kube_pod_container_resource_limits{container="istio-proxy",resource="memory",unit="byte"})
        > 0) > 0.8
      for: 5m
      labels:
        severity: warning
      annotations:
        summary: Proxy working set exceeds80% of its configured limit
    - alert: ConnectionBreakerAtCapacity
      expr: envoy_cluster_circuit_breakers_default_cx_open == 1
      for: 5m
      labels:
        severity: warning
      annotations:
        summary: Connection breaker at capacity
確認済み dashboard templateを使用して、request rate、error fraction、latency、resource unit 用に別々の panel を作成してください。CPU core と memory byte を label のない共通 scale に配置しないでください。
問題 7: Jaeger による Performance Bottleneck の特定
分散トレーシングツール Jaeger を使用して、microservices architecture の performance bottleneck を見つける方法を説明してください。Trace analysis method と実践的な debugging scenario を含めてください。
回答を表示
Jaeger2/OTLP tracing setup、設定済み Telemetry provider、application context propagation から始めてください。古い Jaeger addon/Zipkin port や sampling value だけで tracing が Deployment されると想定しないでください。application/database span には SDK または agent instrumentation が必要です。proxy span は database query の内部を明らかにできません。
- namespace-scoped Prometheus latency query で影響を受けた Service/time window を特定し、Jaeger で代表的な slow trace と normal trace を見つけます。Prometheus histogram query は aggregate statistic を返し、trace ID は返しません。
- critical path をたどり、parent duration と exclusive time を区別します。長い parent には child が含まれます。自動的に原因となるわけではありません。
- error、retry、connection wait、query execution、parallelism を比較します。trace timing、sampling、missing span は結論を制限します。
histogram_quantile(0.99, sum by (destination_service_name, destination_service_namespace, le) (rate(istio_request_duration_milliseconds_bucket{reporter="destination"}[5m]))) > 2000kubectl port-forward -n observability svc/jaeger-query 16686:16686これらは仮想的な debugging scenario であり、benchmark result や literal Jaeger API response ではありません:
| 観測結果 | 確認する内容 | 適切な対応 |
|---|---|---|
| 2.1s request、うち1.8s は instrument 済み database operation | pool wait、query time、lock、network delay を分離し、DB execution plan を確認する | 計測した原因を修正する。redis.conf という ConfigMap は application caching を追加しない |
| connection-pool timeout を伴う ~10s request | application の DB client pool、concurrency、DB capacity を確認する | application/DB pool を調整し leak を修正する。Envoy DestinationRule は application pool を設定せず、HTTP pool setting は PostgreSQL を調整しない |
| 独立した2s+2s+1s の呼び出しが順次実行される | dependency、load limit、tracing context を確認する | real async client または bounded thread で独立した I/O のみを並列化する。想定時間は最長 call + overhead に近づく場合がありますが、2s が保証されるわけではありません |
既存の synchronous I/O callback について、この Python3.9+ fragment は return order を維持し、worker thread を使用します。アプリケーションは callback を提供し、自身の timeout を強制する必要があります。awaiting task をキャンセルしても、すでに実行中の thread は停止しません:
import asyncio

async def get_user_data(user_id):
    # Application-owned synchronous I/O functions; each must enforce its timeout.
    profile, orders, recommendations = await asyncio.gather(
        asyncio.to_thread(call_backend_a, user_id),
        asyncio.to_thread(call_backend_b, user_id),
        asyncio.to_thread(call_backend_c, user_id),
    )
    return merge(profile, orders, recommendations)
Timeout は待機を制限しますが、遅い database を修復するわけではありません。retry は load を増幅する場合があります。VirtualService timeout を示す場合は、実際の route destination を含め、idempotency/load を考慮して retry のみを使用してください。永続的な Jaeger dependency map には追加の aggregation が必要な場合があります。単一 trace waterfall と global dependency map は異なる view です。疑わしい修正は、魅力的な 1 つの trace だけでなく、repeat traffic と metrics/traces で検証してください。
問題 8: Kiali を使用した Service Mesh のトラブルシューティング
Kiali を使用して、Istio service mesh の一般的な問題(設定エラー、traffic anomaly、security policy conflict)を診断し解決する方法を説明してください。
回答を表示
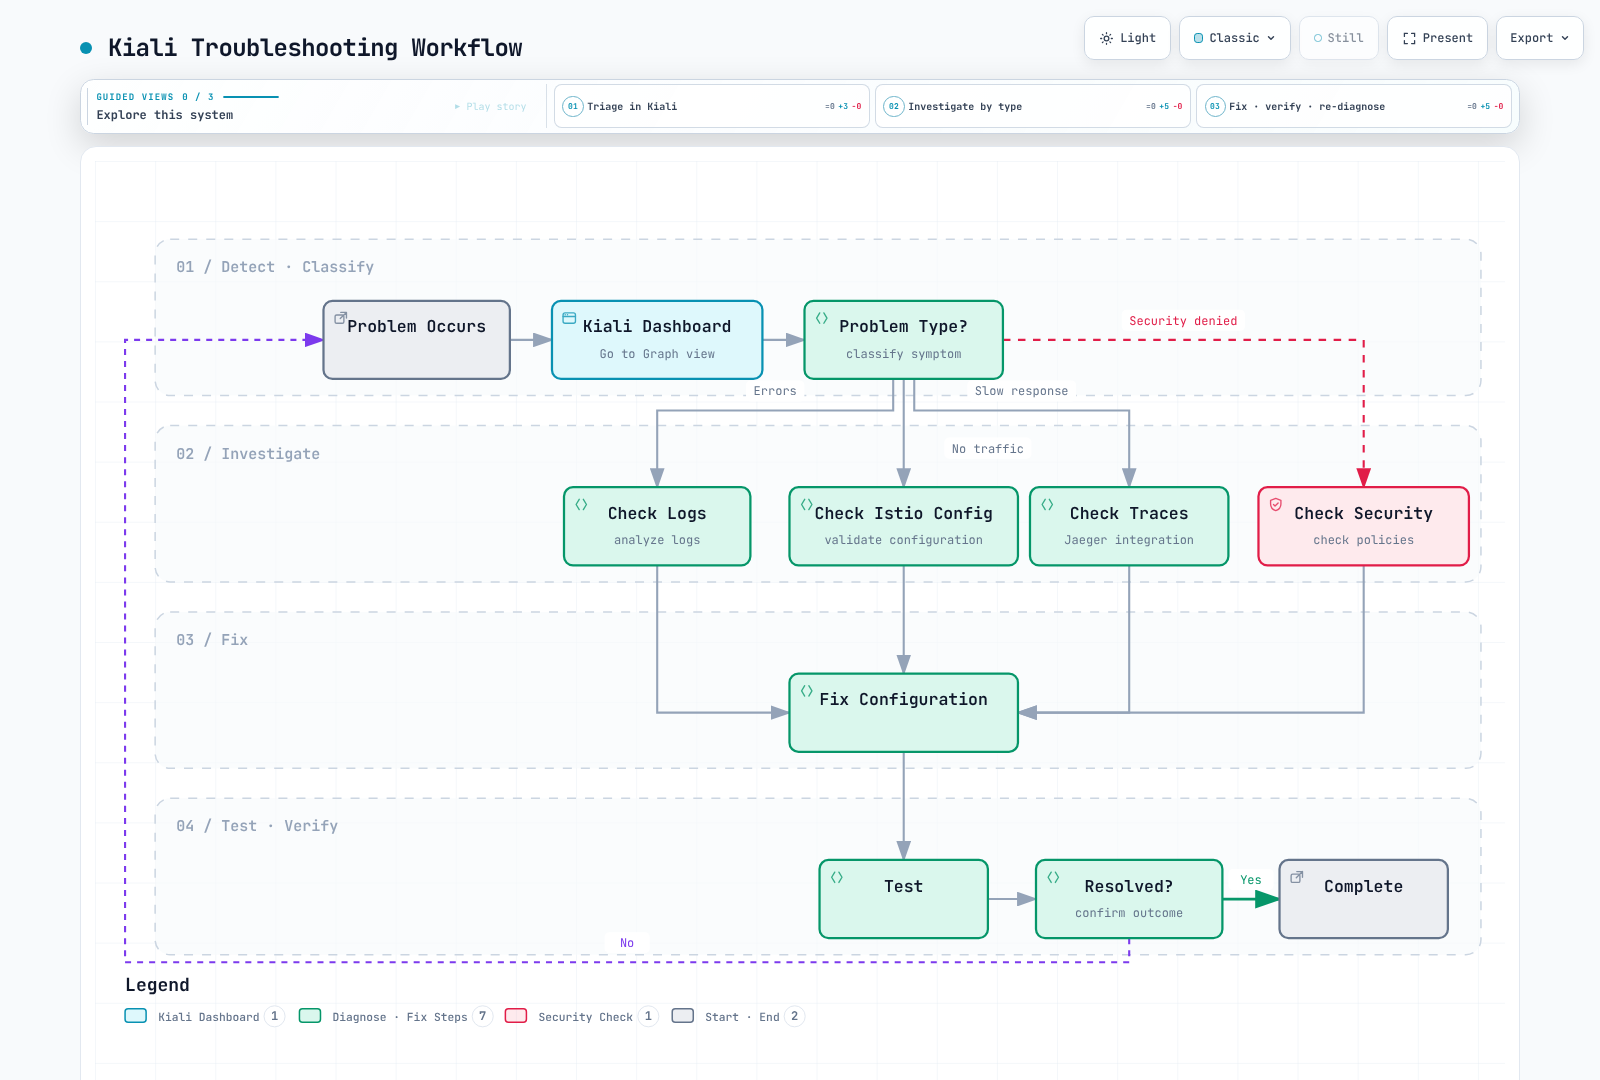
Kiali の configuration check、observed traffic、pod log、trace を根拠として使用し、effective proxy configuration を確認してください。dashboard の章には version/authentication の前提条件が記載されています。graph shape から Kiali warning を捏造したり、green icon を runtime guarantee と見なしたりしないでください。
| 症状 | 正しい解釈と確認 |
|---|---|
| Service/subset がない | default では、reviews と reviews.default.svc.cluster.local は同じ host に解決されます。名前を短縮しても、不足している Service は作成されません。KIA1107 は未定義 subset を識別します。Service/EndpointSlice、DestinationRule、実際の Pod label を確認してください |
| Subset label の不一致 | label value 1.0 は本質的に誤りではありません。subset を意図した Deployment label に一致させてください。完全な DestinationRule を記述する際は metadata、host、document separator を含めてください |
| 設定済み50/50ではなく観測された90/10 | effective weight、matching rule、connection affinity、retry、endpoint/ejection state、time window を確認します。ready replica が少ないだけでは VirtualService subset weight を再定義せず、後の50/50 split を保証しません |
| A↔B cycle | 双方向 graph は recursive call、deadlock、自動 Kiali alert の証明ではありません。application を再設計する前に、trace を使用して実際の意図しない cycle を特定してください |
| HTTP403 | enforcing proxy の policy、identity、response detail を確認してください。empty-spec AuthorizationPolicy は一致 rule のない ALLOW policy です。別の ALLOW が exception を提供する場合があります。これは overriding DENY ではありません |
| mTLS failure | PeerAuthentication は receiver を記述します。特定の direction について、sender TLS setting、receiver policy、enrollment、certificate/trust、port protocol を確認してください。異なる receiver mode が自動的に conflict になるわけではありません。包括的な STRICT は migration decision であり、一般的な修正ではありません |
frontend exception を伴う scoped default-deny baseline は、mTLS が名前付き frontend principal を提供し、それ以前の CUSTOM/DENY が request を拒否しないことを前提に、有効です:
apiVersion: security.istio.io/v1
kind: AuthorizationPolicy
metadata:
  name: backend-default-deny
  namespace: default
spec:
  selector:
    matchLabels:
      app: backend
---
apiVersion: security.istio.io/v1
kind: AuthorizationPolicy
metadata:
  name: backend-allow-frontend
  namespace: default
spec:
  selector:
    matchLabels:
      app: backend
  action: ALLOW
  rules:
  - from:
    - source:
        principals:
- cluster.local/ns/default/sa/frontendkubectl get service reviews -n default
kubectl get endpointslice -n default -l kubernetes.io/service-name=reviews
kubectl get pods -n default -l app=reviews --show-labels
istioctl analyze -n default
istioctl proxy-config clusters <source-pod> -n default --fqdn reviews.default.svc.cluster.local -o json
istioctl x authz check <backend-pod>.defaultTraffic animation は選択された window を要約するものであり、byte-accurate packet inspection ではありません。仮説が失敗した場合は workload を盲目的に restart するのではなく、diagnosis/configuration/test loop を繰り返してください。
問題 9: Production Observability Stack のセットアップ
production Kubernetes cluster 向けに、Istio observability stack(Prometheus、Grafana、Jaeger、Kiali)を High Availability (HA) 構成で Deployment する方法を説明してください。persistent storage、scaling、backup 戦略を含めてください。
回答を表示
production HA stack は、環境固有の設計および検証作業です。以下では主な要件を扱いますが、production-tested Deployment bundle ではありません。互換性のある Kubernetes/Istio/operator/chart/backend version を固定し、実際に使用する chart value をレビューし、rollout 前に failure と restore behavior を検証してください。dashboard の章には現在の Kiali compatibility gap が記録されています。latest release から compatibility を推測しないでください。
| Component | State と HA 要件 |
|---|---|
| Prometheus | replica ごとに PVC を持つ独立した replica を実行し、その cluster の replica 間で共有される cluster label と、異なる replica label を使用します(deduplication のため、他の label は一致する必要があります)。failure domain を分散し、observed ingest に合わせて retention をサイズ設定します。load balancer は history を結合しません |
| Thanos | Sidecar は StoreAPI を公開し、任意で block を upload します。Query は実際の StoreAPI endpoint を検出し、設定済み replica label を deduplicate します。Store Gateway は object storage を読み取ります。Compactor は適切な single-writer/sharding ownership で block compaction/retention を処理します |
| Grafana | 2 replica には共有 HA PostgreSQL/MySQL database、一貫した provisioning/plugin/secret configuration、load balancer が必要です。node 間で SQLite または 1 つの EBS ReadWriteOnce volume を共有する 2 replica は Grafana HA ではありません |
| Alertmanager | replica には peer/notification deduplication configuration、persistent state、保護された receiver credential が必要です。chart value に Slack webhook を配置するだけでは完全な secret/notification design ではありません |
| Jaeger2/collector | サポート対象の durable backend と、その固有の HA/TLS/credential を使用して stateless query/collector replica を利用します。tail sampler には trace-ID affinity が必要です。random Service の背後にある複数 replica は完全な trace を受信しません |
| Kiali | 互換性のある operator/server、共有 configuration/session-secret behavior、適切な Pod placement を使用します。backend API と user namespace permission を保護します。token strategy は single-cluster 向けです。必要に応じて、文書化された multi-cluster authentication を選択してください |
Storage と object-store の接続:
- object storage を使用しても local Prometheus persistence を維持します。最近の head/WAL data はまだ upload されていない場合があります。sidecar upload では、インストール済み Thanos version の local-compaction/block-duration 要件に従ってください。
- S3 bucket、regional endpoint、encryption、retention、IAM permission が存在する必要があります。credential を持つ ServiceAccount を、実際に sidecar/Store/Compactor を実行する Pod に bind してください。“IRSA” と書いた YAML comment では credential は作成されません。current Thanos S3 configuration では、サポート対象 AWS SDK credential chain で
aws_sdk_auth: trueを使用できます。 - current kube-prometheus-stack value では、existing object-store Secret は実際の name/key とともに
prometheus.prometheusSpec.thanos.objectStorageConfig.existingSecretの下で選択されます。keythanos.yamlを mount しても、objstore.yamlという file は作成されません。file path、名前付き gRPC Service port、DNS-SRV target を確認してください。 - current Thanos Query は endpoint/deduplication configuration に
--endpointと--query.replica-labelを使用します。選択した release を確認せずに、古い--storeの例を流用しないでください。Prometheus-compatible backend を query する Kiali にも、文書化されたthanos_proxysetting が必要になる場合があります。 - 各 Deployment/StatefulSet には一致する selector/pod label と Service が必要です。元の不完全な resource では、動作する StoreAPI topology を形成できませんでした。EKS では、EBS-backed state にサポート対象の EC2 placement/CSI configuration が必要です。Fargate は EBS を mount せず、任意の DaemonSet を実行できません。
Configuration、backup、proof:
- 実際の monitor/rule selector と scrape target を設定します。kube-prometheus-stack では、
alertmanager.configはalertmanager.alertmanagerSpecの sibling です。固定した chart schema を確認してください。password/webhook はサポート対象の Secret reference に保持します。 - Grafana の database/configuration/provisioned dashboard/plugin、必要に応じた Prometheus state、Jaeger storage を application-consistent procedure で backup します。object-store retention だけでは、すべての component の restore strategy にはなりません。
- Velero PVC/PV manifest だけでは、volume data が capture されたことを証明しません。サポート対象の CSI snapshot/data-mover または filesystem backup path、snapshot class/plugin、credential、workload restore に必要な resource を設定します。backup status を確認し、isolated restore を実行してください。
- backup Job には、必要な tool を含むテスト済み image、正しい source URL、scoped identity、destination bucket、failure handling が必要です。古い AWS CLI image/想定された curl+jq/S3 CronJob は検証済み backup solution ではありません。
- receiver/exporter failure、queueing、scrape health、実際の PVC capacity metric を監視します。
prometheus_tsdb_storage_blocks_bytes_totalは有効な capacity denominator ではありません。stack は自身の total outage を確実に報告できません。独立した heartbeat/observer を使用し、missing-series/no-data をup == 0とは別に処理してください。 - replica/node/zone の喪失、storage interruption、backend/authentication failure、rollout、restoration をテストします。PDB は計画的な disruption に役立ちますが、database または zone-level HA を作成しません。replica count から RPO/RTO を主張するのではなく、RPO/RTO と observed capacity を記録してください。
Grafana HA、Thanos Sidecar、Thanos Query、Thanos storage、Velero CSI backupを参照してください。
問題 10: Custom Metrics と Dashboard の作成
Istio Envoy が収集する default metrics を超えて、business metrics(例: order count、payment success rate)を収集し、Grafana custom dashboard を作成する方法を説明してください。
回答を表示
metric を選択する前に、business event と counting boundary を定義してください。Envoy は request を認識しますが、order が durably created されたか、payment が settled したかは認識しません。以下のintegration fragment は完了した processing attempt を数えるものであり、unique order や accounting revenue ではありません。アプリケーションは processing function/error contract、idempotency、validation を提供する必要があります。真の payment-success metric では、payment boundary で payment outcome を instrument し、outcome counter から ratio を導出してください。保守されない Gauge は success rate ではありません。
bounded category/status label、attempt 用の Counter、nonnegative amount/duration 用の Histogram を使用します。failure を含めるため、finally で duration を observe してください。order ID、user ID、raw URL を metric の label にしないでください。これらの例は single-process 向けです。multi-worker aggregation には client library のサポート対象 setup が必要です。
Python/Flask(アプリケーションが process_order と PaymentException を提供します):
from flask import Flask, request, jsonify, Response
from prometheus_client import Counter, Histogram, generate_latest, CONTENT_TYPE_LATEST
import time

# Integration fragment: your application supplies process_order and PaymentException.
# process_order returns a validated nonnegative USD amount and category after processing.
app = Flask(__name__)
CATEGORIES = {"books", "electronics", "other"}
STATUSES = ("success", "payment_failed", "error")
orders_total = Counter("orders_total", "Completed order-processing attempts", ["status", "product_category"])
order_amount = Histogram("order_amount_dollars", "Observed amounts of successful attempts in USD",
                         buckets=[10, 50, 100, 500, 1000, 5000])
order_duration = Histogram("order_processing_duration_seconds", "Order attempt duration, including failures",
                           buckets=[0.1, 0.5, 1.0, 2.0, 5.0])
for status in STATUSES:
    for category in CATEGORIES:
        orders_total.labels(status=status, product_category=category).inc(0)

@app.post("/api/orders")
def create_order():
    payload = request.get_json()
    started = time.perf_counter()
    try:
        order = process_order(payload)
        category = order["category"] if order["category"] in CATEGORIES else "other"
        orders_total.labels(status="success", product_category=category).inc()
        order_amount.observe(order["amount"])
        return jsonify(order), 201
    except PaymentException:
        orders_total.labels(status="payment_failed", product_category="other").inc()
        return jsonify({"error": "Payment failed"}), 400
    except Exception:
        orders_total.labels(status="error", product_category="other").inc()
        return jsonify({"error": "Order processing failed"}), 500
    finally:
        order_duration.observe(time.perf_counter() - started)

@app.get("/metrics")
def metrics():
    return Response(generate_latest(), content_type=CONTENT_TYPE_LATEST)

# Use the application's server lifecycle. Do not treat a Flask development server
# or process-local counters as a production accounting system.Node.js/Express: 維持されている package は @prometheus-io/client です(example API は Node 22 上の 0.16.1 で確認済みです)。prom-client は非推奨となり、この package に移行しました。既存 project は migration changelog をレビューする必要があります。JSON middleware を設定し、register.metrics() を await してください:
const express = require('express');
const client = require('@prometheus-io/client'); // Example verified with 0.16.1, Node 22
const app = express();
app.use(express.json());
const register = new client.Registry();
const categories = new Set(['books', 'electronics', 'other']);
const ordersTotal = new client.Counter({
  name: 'orders_total', help: 'Completed order-processing attempts',
  labelNames: ['status', 'product_category'], registers: [register]
});
const orderAmount = new client.Histogram({
  name: 'order_amount_dollars', help: 'Observed successful attempt amounts in USD',
  buckets: [10, 50, 100, 500, 1000, 5000], registers: [register]
});
const orderDuration = new client.Histogram({
  name: 'order_processing_duration_seconds', help: 'Order attempt duration, including failures',
  buckets: [0.1, 0.5, 1, 2, 5], registers: [register]
});
for (const status of ['success', 'payment_failed', 'error']) {
  for (const product_category of categories) ordersTotal.inc({status, product_category}, 0);
}
// The application supplies async processOrder with validated amount/category output.
app.post('/api/orders', async (req, res) => {
  const end = orderDuration.startTimer();
  try {
    const order = await processOrder(req.body);
    const product_category = categories.has(order.category) ? order.category : 'other';
    ordersTotal.inc({status: 'success', product_category});
    orderAmount.observe(order.amount);
    res.status(201).json(order);
  } catch (error) {
    const status = error.code === 'PAYMENT_FAILED' ? 'payment_failed' : 'error';
    ordersTotal.inc({status, product_category: 'other'});
    res.status(status === 'payment_failed' ? 400 : 500).json({error: 'Order processing failed'});
  } finally {
    end();
  }
});
app.get('/metrics', async (req, res) => {
  try {
    res.set('Content-Type', register.contentType);
    res.end(await register.metrics());
  } catch (error) {
    res.status(500).end();
  }
});
// Integrate app.listen/shutdown with the application's server lifecycle.
Kubernetes collection: この sidecar lab は、plaintext application scrape が STRICT mTLS を通過すると想定しないよう Istio の merged endpoint を使用します。これらの label/annotation を、default の実際の order-service Deployment にマージしてください。その image には application を含め、8080 で /metrics を公開する必要があります。mesh では Prometheus merging を有効にする必要があります。agent endpoint15020 は cleartext のため、network access を制限してください。既存 scraper がすでにこれらの business metrics を収集している場合は、duplicate monitor を追加しないでください。
spec:
  template:
    metadata:
      labels:
        app: order-service
      annotations:
        prometheus.io/scrape: 'true'
        prometheus.io/path: /metrics
        prometheus.io/port: '8080'
prometheus.istio.io/merge-metrics: 'true'apiVersion: v1
kind: Service
metadata:
name: order-service
namespace: default
labels:
app: order-service
spec:
selector:
app: order-service
ports:
- name: http
port: 8080
targetPort: 8080
- name: merged-metrics
port: 15020
targetPort: 15020
---
apiVersion: monitoring.coreos.com/v1
kind: ServiceMonitor
metadata:
name: order-service-metrics
namespace: istio-system
spec:
namespaceSelector:
matchNames:
- default
selector:
matchLabels:
app: order-service
targetLabels:
- app
endpoints:
- port: merged-metrics
path: /stats/prometheus
interval: 30s
metricRelabelings:
- sourceLabels:
- __name__
regex: orders_total|order_amount_dollars_(bucket|sum|count)|order_processing_duration_seconds_(bucket|sum|count)
action: keepPrometheus resource は istio-system の ServiceMonitor を選択する必要があり、default の Service を検出します。business metric family のみを維持することで、他で既に scrape されている proxy metric の重複を避けます。targetLabels は Service の app label を明示的に追加します。これは sidecar の例です。ambient/direct TLS scraping には独自のサポート対象 design が必要です。
Query(順に、interval attempt count、attempt/second、success fraction、observed amount P95、duration P99、category rate、order attempt における payment-failure fraction):
sum(increase(orders_total{namespace="default",app="order-service"}[5m]))

sum(rate(orders_total{namespace="default",app="order-service"}[5m]))

sum(rate(orders_total{namespace="default",app="order-service",status="success"}[5m])) / sum(rate(orders_total{namespace="default",app="order-service"}[5m]))

histogram_quantile(0.95, sum by (le) (rate(order_amount_dollars_bucket{namespace="default",app="order-service"}[5m])))

histogram_quantile(0.99, sum by (le) (rate(order_processing_duration_seconds_bucket{namespace="default",app="order-service"}[5m])))

sum by (product_category) (rate(orders_total{namespace="default",app="order-service"}[5m]))

sum(rate(orders_total{namespace="default",app="order-service",status="payment_failed"}[5m])) / sum(rate(orders_total{namespace="default",app="order-service"}[5m]))
increase は interval total を推定します。rate は秒あたりです。process restart、retry、missed scrape は、operational counter/amount sum が accounting ledger ではないことを意味します。unique committed order や revenue については、telemetry が exactly-once であると想定するのではなく、durable business system と照合してください。
Grafana: この完全な dashboard object は datasource UID prometheus と上記 monitor の label を想定します。API wrapper なしで保存し、文書化された dashboard file provisioningを使用してください。ConfigMap label 単体では provider を設定しません。
{
  "uid": "order-business-metrics",
  "title": "Order Processing Operational Metrics",
  "timezone": "browser",
  "panels": [
    {
      "id": 1,
      "title": "Completed Attempts per Minute",
      "type": "timeseries",
      "datasource": {
        "type": "prometheus",
        "uid": "prometheus"
      },
      "targets": [
        {
          "expr": "sum(rate(orders_total{namespace=\"default\",app=\"order-service\"}[5m])) * 60",
          "refId": "A"
        }
      ],
      "gridPos": {
        "x": 0,
        "y": 0,
        "w": 12,
        "h": 8
      }
    },
    {
      "id": 2,
      "title": "Attempt Success Fraction",
      "type": "gauge",
      "datasource": {
        "type": "prometheus",
        "uid": "prometheus"
      },
      "targets": [
        {
          "expr": "sum(rate(orders_total{namespace=\"default\",app=\"order-service\",status=\"success\"}[5m])) / sum(rate(orders_total{namespace=\"default\",app=\"order-service\"}[5m]))",
          "refId": "A"
        }
      ],
      "gridPos": {
        "x": 12,
        "y": 0,
        "w": 12,
        "h": 8
      },
      "fieldConfig": {
        "defaults": {
          "unit": "percentunit"
        }
      }
    },
    {
      "id": 3,
      "title": "Processing P95",
      "type": "timeseries",
      "datasource": {
        "type": "prometheus",
        "uid": "prometheus"
      },
      "targets": [
        {
          "expr": "histogram_quantile(0.95, sum by (le) (rate(order_processing_duration_seconds_bucket{namespace=\"default\",app=\"order-service\"}[5m])))",
          "refId": "A"
        }
      ],
      "gridPos": {
        "x": 0,
        "y": 8,
        "w": 12,
        "h": 8
      },
      "fieldConfig": {
        "defaults": {
          "unit": "s"
        }
      }
    },
    {
      "id": 4,
      "title": "Observed Successful Attempt Amount (Last Hour)",
      "type": "stat",
      "datasource": {
        "type": "prometheus",
        "uid": "prometheus"
      },
      "targets": [
        {
          "expr": "sum(increase(order_amount_dollars_sum{namespace=\"default\",app=\"order-service\"}[1h]))",
          "refId": "A"
        }
      ],
      "gridPos": {
        "x": 12,
        "y": 8,
        "w": 12,
        "h": 8
      },
      "fieldConfig": {
        "defaults": {
          "unit": "currencyUSD"
        }
      }
    }
  ],
  "time": {
    "from": "now-1h",
    "to": "now"
  },
  "refresh": "30s"
}Alert: この rule はインストール済み Prometheus Operator が選択します。minimum traffic threshold は no traffic での ratio alert を回避します。absence/scrape failure には別の signal が必要です。threshold は例であり、business SLO guarantee ではありません。
apiVersion: monitoring.coreos.com/v1
kind: PrometheusRule
metadata:
  name: business-metrics-alerts
  namespace: istio-system
spec:
  groups:
  - name: business-metrics
    rules:
    - alert: LowOrderAttemptSuccessFraction
      expr: (sum(rate(orders_total{namespace="default",app="order-service",status="success"}[5m])) / sum(rate(orders_total{namespace="default",app="order-service"}[5m]))
        < 0.95) and (sum(rate(orders_total{namespace="default",app="order-service"}[5m])) > 0.1)
      for: 5m
      labels:
        severity: warning
      annotations:
        summary: Order-processing attempt success fraction below95%
    - alert: SlowOrderProcessing
      expr: histogram_quantile(0.95, sum by (le) (rate(order_processing_duration_seconds_bucket{namespace="default",app="order-service"}[5m])))
        > 2
      for: 5m
      labels:
        severity: warning
      annotations:
        summary: P95 processing attempt duration exceeds2s
metric type、exposition、process model については、Python client と JavaScript client のドキュメントを参照してください。
スコア計算
- 選択式問題 1-5: 各 10 点(合計 50 点)
- 記述式問題 6-10: 各 10 点(合計 50 点)
- 合計: 100 点
評価基準:
- 90-100 点: これらのトピックについて優れた理解がある
- 80-89 点: 十分な理解がある。Deployment の検証は別途必要
- 70-79 点: 平均的(追加の学習を推奨)
- 60-69 点: 平均以下(基本概念の見直しが必要)
- 0-59 点: 再学習が必要