Istioダッシュボード
レビュー基準: Istio 1.31。Kiali互換性には後述の条件があります。 最終更新: September 11, 2026
Grafana、Kiali、Prometheusで設定済みテレメトリーを調べます。例は公式資料とオフライン検証で確認した演習パターンで、デプロイや本番負荷テストはしていません。Backend可用性、認証、名前空間権限、ストレージ、版互換性は明示的な前提条件です。
目次
ダッシュボード概要
可観測性スタックのアーキテクチャ
KialiはKubernetes APIからIstioリソースを読み、Prometheusを照会します。istiodはKialiに設定を送るのでなくプロキシを設定します。Grafanaは設定済みメトリクス/ログ/トレースbackendを照会します。Prometheusはプロキシメトリクスをスクレイプし、collectorがアクセスログ/スパンを送り、トレース対象アプリはコンテキストを伝播する必要があります。
ツールごとの目的
| ツール | 主用途 | データソース |
|---|---|---|
| Kiali | サービストポロジー、通信分析、設定検証 | Prometheus、Istio設定 |
| Grafana | メトリクス可視化、アラート、ログ分析 | Prometheus、Loki、Tempo |
| Prometheus | メトリクス収集とクエリ | Envoy、istiod |
| Jaeger | 分散トレース分析 | Envoyスパン |
Kiali
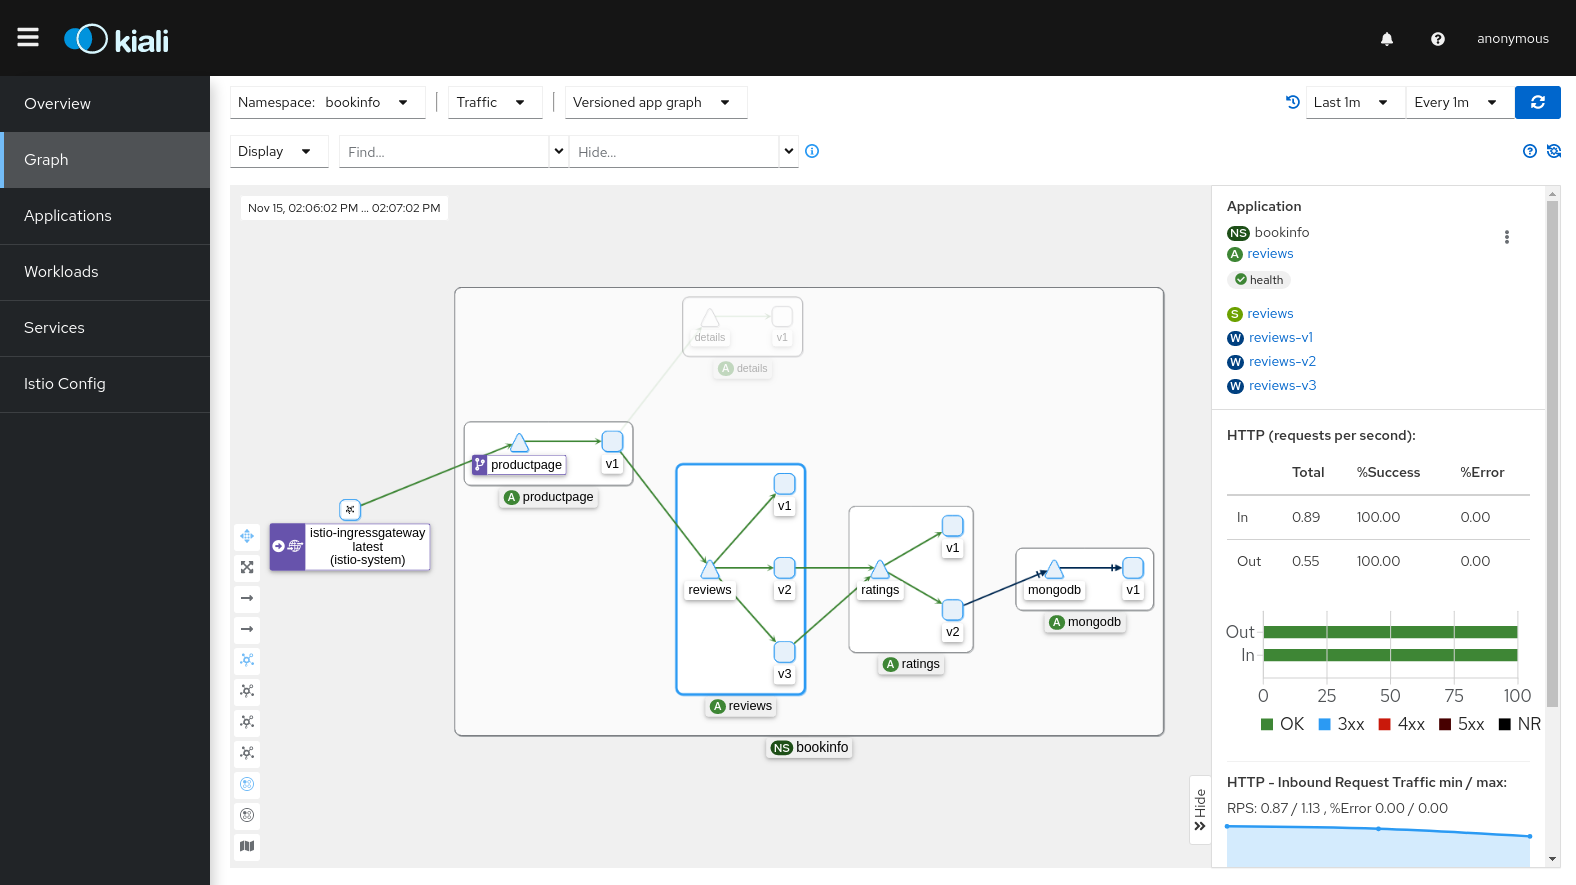
KialiはIstioメッシュの可観測性コンソールです。サービストポロジーのリアルタイム可視化、通信分析、Istio設定検証を行います。
Kialiの中核的価値
- サービスグラフ可視化: マイクロサービスの関係と通信を直感的に表示
- リアルタイム監視: 要求レート、エラー率、応答時間をリアルタイム表示
- 設定検証: VirtualService、DestinationRuleなどIstio CRDのエラー検出
- mTLS状態確認: サービス間mTLS適用を視覚的に確認
- 分散トレース統合: Jaeger連携でグラフから直接トレースを表示
インストール例と互換性
Kiali 2.31.0とOperatorはAugust 23, 2026にリリースされました。公表互換表は現在Istio 1.30にKiali 2.26+、Istio 1.29にKiali 2.21+を示しますが、Istio 1.31はまだ明示掲載されていません。以下は文書上互換なIstio向けKiali 2.31設定例として扱います。1.31と組み合わせる前に現メンテナーのガイダンスと代表演習で互換性を確認します。版番号一致も「最新」も証明ではありません。例のためだけに既存メッシュをダウングレードしないでください。
1. Kiali Operatorのインストール
helm repo add kiali https://kiali.org/helm-charts
helm repo update kiali
helm install kiali-operator kiali/kiali-operator \
  --namespace kiali-operator --create-namespace --version 2.31.0
kubectl get pods -n kiali-operator
2. 範囲を限定した閲覧専用Kiali CRの作成
Istioメトリクスを持つ到達可能Prometheusが必要です。Service名が異なればURLを合わせます。後のOperator例はistio-systemにprometheusを定義します。Operatorは自身の名前空間とdiscoveryセレクターに一致する名前空間へのアクセスをKialiに与えます。cluster_wide_access: falseではサーバーへのクラスターワイド権限でなく、名前空間権限を作ります。利用者RBACでさらに可視範囲を狭められます。
apiVersion: kiali.io/v1alpha1
kind: Kiali
metadata:
  name: kiali
  namespace: istio-system
spec:
  deployment:
    cluster_wide_access: false
    discovery_selectors:
      default:
      - matchExpressions:
        - key: kubernetes.io/metadata.name
          operator: In
          values:
          - default
          - app
          - production
    view_only_mode: true
    replicas: 1
    resources:
      requests:
        cpu: 100m
        memory: 256Mi
      limits:
        cpu: 500m
        memory: 1Gi
  auth:
    strategy: token
  external_services:
    prometheus:
      url: http://prometheus.istio-system.svc.cluster.local:9090
    grafana:
      enabled: false
    tracing:
enabled: falsekiali-cr.yamlとして保存し適用します。調整前に対象アプリ名前空間を作ります。KialiはIstioのdiscoveryセレクターを自動継承しません。旧accessible_namespacesはKiali 2.0で削除されました。Grafana/トレース統合はエンドポイント、認証情報、互換性を設定するまで無効です。
kubectl apply -f kiali-cr.yaml
kubectl get kiali,pods -n istio-system
kubectl port-forward -n istio-system svc/kiali 20001:20001
外部アクセスには保守中のIngress/Gateway、TLS証明書、認証、ブラウザー到達URLを別設定します。例はIngress controller、cert-manager issuer、公開エンドポイントを導入しません。proxy-status機能はistiodデバッグAPIに依存する場合があります。意図的に無効ならexternal_services.istio.istio_api_enabled: falseを設定し、全表示が利用可能と考えず制限を受け入れます。
Kialiへのアクセス
port-forward後にhttp://localhost:20001を開きます。token認証はKubernetes ServiceAccountトークンとその名前空間権限を使います。意図したRBACの専用閲覧IDを使用し、Kialiサーバー/OperatorのServiceAccountを便利な管理者ログインに使わないでください。作成・権限付与済みアカウントでは次のようにします。
kubectl create token kiali-viewer -n default --duration=1h実トークン寿命はAPIサーバーが決めます。token方式は単一クラスター対応です。マルチクラスター/OIDCには文書化された認証設定、登録redirect URI、名前空間認可が必要で、client IDとissuer URLだけでは完全な本番設定ではありません。Kiali前提条件と名前空間管理を参照します。
Kialiの主な機能
1. サービスグラフ(Graph)
概要:
- 名前空間ごとのサービストポロジー可視化
- 通信フローと要求レート(RPS)表示
- エラー率と応答時間の可視化
- バージョン別の通信分布確認
通信アニメーションは選択窓と更新間隔の集計を示します。パケットキャプチャや要求ごと1点の表示ではありません。定量分析には辺のメトリクスを使います。
グラフ表示タイプ:
| 表示タイプ | 説明 | 用途 |
|---|---|---|
| App Graph | アプリ単位 | サービス依存の理解 |
| Versioned App Graph | 版別アプリ | カナリア監視 |
| Workload Graph | ワークロード単位 | Deployment/StatefulSet分析 |
| Service Graph | Service単位 | Kubernetes Service中心の表示 |
グラフフィルターオプション:
# Edge label display
- Request percentage: Traffic distribution rate (%)
- Request rate: Request rate (RPS)
- Response time: Selected latency statistic
- Throughput: Throughput (bytes/sec)

# Display options
- Traffic Animation: Real-time traffic flow
- Service Nodes: Show service nodes
- Traffic Distribution: Version-based traffic distribution
- Security: mTLS lock icon
- Circuit Breakers: Circuit breaker status
- Virtual Services: VirtualService icon検索/非表示機能:
# Find slow edges
Find: response time > 1s
Expression: rt > 1000

# Find unhealthy nodes
Find: unhealthy nodes
Expression: ! healthy

# Hide specific services
Hide: kube-system namespace
2. Applications表示
各アプリの詳細:
- Overview: 全体状態の要約
- Traffic: 受信/送信メトリクス
- 要求量(RPS)
- 要求時間(P50、P95、P99)
- 要求サイズ / 応答サイズ
- Inbound Metrics: 受信通信分析
- 送信元ワークロード
- 要求プロトコル(HTTP/gRPC/TCP)
- 応答コード
- Outbound Metrics: 送信通信分析
- 宛先サービス
- 応答時間
- エラー率
3. Workloads表示
Deployment、StatefulSetなど各ワークロードの詳細:
- Pods: Pod一覧と状態
- Services: 接続Service一覧
- Logs: リアルタイムPodログ(Envoy + アプリ)
- Metrics: ワークロードメトリクス
- 要求量
- 時間(P50/P95/P99)
- エラー率
- Traces: Jaeger統合の分散トレース
- Envoy: Envoy設定確認
- クラスター
- リスナー
- ルート
- Bootstrap設定
4. Services表示
Kubernetes Serviceごとの詳細:
- Overview: Serviceメタデータ
- Traffic: 通信メトリクス
- Inbound Metrics: クライアント別要求分析
- Traces: サービス呼び出しトレース
5. Istio設定検証(Istio Config)
Kialiは利用可能なクラスター状態で対応Istioリソースを検証します。閲覧専用例は設定を調べられますが、編集は別の認可権限が必要です。緑のチェックは実装された確認の通過で、実行時の正しさの証明ではありません。
検証対象:
- VirtualService
- DestinationRule
- Gateway
- ServiceEntry
- Sidecar
- PeerAuthentication
- RequestAuthentication
- AuthorizationPolicy
- Telemetry
検証レベル:
| アイコン | レベル | 説明 |
|---|---|---|
| ✅ | 有効 | 利用可能な確認を通過 |
| ⚠️ | 警告 | 潜在的問題(ベストプラクティス違反) |
| ❌ | エラー | 設定エラーを検出。API受付は成功する場合あり |
検証例: KIA1107、subsetがない
default内で短いreviewsはreviews.default.svc.cluster.localに解決し、両形式だけではhost不一致ではありません。KIA0101はAuthorizationPolicyの参照名前空間がないことです。以下の意図的な不正例はv1だけを定義しv2へ送ります。
apiVersion: networking.istio.io/v1
kind: VirtualService
metadata:
  name: reviews
  namespace: default
spec:
  hosts:
  - reviews.default.svc.cluster.local
  http:
  - route:
    - destination:
        host: reviews.default.svc.cluster.local
        subset: v2
---
apiVersion: networking.istio.io/v1
kind: DestinationRule
metadata:
  name: reviews
  namespace: default
spec:
  host: reviews.default.svc.cluster.local
  subsets:
  - name: v1
    labels:
      version: v1
参照subsetを定義し一致エンドポイントをデプロイするか、意図した既存subsetへ送ります。Bookinfo両版が存在するとして、このDestinationRuleは両ラベルを提供します。
apiVersion: networking.istio.io/v1
kind: DestinationRule
metadata:
  name: reviews
  namespace: default
spec:
  host: reviews.default.svc.cluster.local
  subsets:
  - name: v1
    labels:
      version: v1
  - name: v2
    labels:
      version: v2
Kubernetesは意味上の経路エラーがあるマニフェストも受け入れ得るため、設定警告/エラーとAPI受付失敗は同じではありません。
6. セキュリティ
mTLS状態確認
グラフのセキュリティ表示を選択時間窓と実効PeerAuthenticationと併せて使います。mTLS通信の観測は平文禁止の証明ではありません。PERMISSIVEでも観測時間内の全通信が暗号化される場合があります。通信/テレメトリー欠損は安全の証明ではなく、ポリシーラベルだけでも認可の有効性は成立しません。設定と許可/拒否テストで確認します。
セキュリティダッシュボード:
- 名前空間別mTLS状態
- PeerAuthentication適用状態
- AuthorizationPolicyの効果
7. 分散トレース統合
KialiはJaegerと統合し、サービスグラフから直接トレースを表示します。
使い方:
- グラフのサービスノードをクリック
- 「View Traces」リンクをクリック
- Jaeger UIへ自動移動し、そのサービスのトレースを表示
トレース詳細:
- スパン時間(各サービスの処理時間)
- 計装スパン属性/イベント(ヘッダーは自動取得されない)
- エラー詳細
- サービス依存マップ
Kialiの高度な機能
トラフィック移行の可視化
apiVersion: networking.istio.io/v1
kind: VirtualService
metadata:
  name: reviews-canary
  namespace: default
spec:
  hosts:
  - reviews.default.svc.cluster.local
  http:
  - route:
    - destination:
        host: reviews.default.svc.cluster.local
        subset: v1
      weight: 90
    - destination:
        host: reviews.default.svc.cluster.local
        subset: v2
      weight: 10
---
apiVersion: networking.istio.io/v1
kind: DestinationRule
metadata:
  name: reviews
  namespace: default
spec:
  host: reviews.default.svc.cluster.local
  subsets:
  - name: v1
    labels:
      version: v1
  - name: v2
    labels:
      version: v2
設定重みは90/10です。Kialiは選択窓の実要求レートを表示します。標本変動、エラー、経路条件で観測比率は異なり得ます。両subsetに一致エンドポイントがある前提です。
カナリア監視:
- 版別の観測要求レートと設定90/10の比較
- 版別エラー率比較
- 版別応答時間(P50、P95、P99)
- リアルタイム通信アニメーションで分布確認
名前空間分離とアクセス制御
同じKialiの代替セレクター設定で、重複デプロイの追加ではありません。cluster-wide access無効時はサーバーアクセスをteam-aと自身の制御名前空間に限定し、ユーザーRBACも適用されます。OpenIDは別認証作業です。現Keycloakはカスタム/auth接頭辞がなければ/realms/...がデフォルトです。
apiVersion: kiali.io/v1alpha1
kind: Kiali
metadata:
  name: kiali
  namespace: istio-system
spec:
  deployment:
    cluster_wide_access: false
    discovery_selectors:
      default:
      - matchLabels:
          kubernetes.io/metadata.name: team-a
    view_only_mode: true
    replicas: 1
    resources:
      requests:
        cpu: 100m
        memory: 256Mi
      limits:
        cpu: 500m
        memory: 1Gi
  auth:
    strategy: token
Grafanaダッシュボード
公式Istioダッシュボード
以下はタイトルだけでなく、取得したIstio1.31.0リビジョンに照らして確認しました。導入リリース用を選び、インポート時にPrometheusデータソースを対応付けます。最新リビジョンが旧メッシュと自動的に互換なわけではありません。
| ダッシュボード | ID | 確認済みリビジョン | 範囲 |
|---|---|---|---|
| Istio Mesh | 7639 | 330 | 全体通信、成功/4xx/5xx、ワークロード概要、コンポーネント版 |
| Istio Service | 7636 | 329 | client/server量、時間、サイズ、TCP、送受信ワークロード |
| Istio Workload | 7630 | 330 | ワークロード受信/送信HTTP/TCP |
| Istio Performance | 11829 | 329 | プロキシ/istiod vCPU、メモリ、ディスク、データレート、goroutine |
| Istio Control Plane | 7645 | 329 | リソース、xDS push/エラー/時間、検証/注入Webhook |
| Istio Wasm Extension | 13277 | 287 | Wasm VM/runtime/cache/remote-loading状態 |
| Istio Ztunnel | 21306 | 97 | Ambient L4接続、バイト、DNS、xDS、プロセスリソース |
Serviceのservice変数はサービスhostで、1.31には汎用namespaceでなくsrcns/dstnsフィルターがあります。Workloadにはnamespaceとworkloadがあります。深いリンク設定前に取得revisionの変数を確認します。ID7636、11829、13277はそれぞれService、Performance、Wasmであり、Workload、汎用Mesh、Gatewayではありません。
Grafana UIでインポートしデータソースを選びます。新規テストでは固定samples/addons/grafana.yamlに同梱されていますが、本番向け強化済みではありません。既存環境は第2Grafanaを入れず文書化されたプロビジョニングを使います。
コミュニティのLoki Dashboard14876
確認済み項目はGrafana Loki Dashboard for Istio Service Mesh、revision3です。特定Envoy text形式用patternパーサーでstatus_codeとreq_idを使い、datasource/label/job/instance変数があります。要求/状態数、バイト、最近の要求、時間、visitor/path/user-agent要約を含みます。mTLSセキュリティを証明せず、以前ここで主張した全パネルも提供しません。
curl -fL -o istio-loki-dashboard.json \
  https://grafana.com/api/dashboards/14876/revisions/3/download
ファイルを確認してUIからインポートし、Lokiを対応付けます。ラベル付きConfigMap作成だけではデータソース入力は解決されず、ローダーも入りません。このrevisionは本ガイドのJSON provider/Alloyラベルと直接互換ではありません。ログ章の確認済みダッシュボードとクエリを使うか、パーサー、フィールド、ラベルを明示調整します。ログ統計は保持ログを表し、フィルター/サンプリングで偏り得ます。
メトリクスのアラートルール
以下はPrometheus OperatorのPrometheusRuleで、Grafana管理アラート設定ではありません。Grafana管理はquery-data/condition/UIDを使い、その経路ではGrafanaで設定し対応形式をエクスポートします。下のOperatorはistio-systemのルールを選びます。しきい値はSLO/通信量に合わせる例です。HTTP5xxはgRPC/アプリ失敗の完全定義ではありません。
apiVersion: monitoring.coreos.com/v1
kind: PrometheusRule
metadata:
  name: istio-alerts
  namespace: istio-system
spec:
  groups:
  - name: istio-service-alerts
    rules:
    - alert: HighErrorRate
      expr: sum by (destination_service_name, destination_service_namespace) (rate(istio_requests_total{reporter="destination",response_code=~"5.."}[5m]))
        / sum by (destination_service_name, destination_service_namespace) (rate(istio_requests_total{reporter="destination"}[5m]))
        > 0.05
      for: 2m
      labels:
        severity: warning
      annotations:
        summary: High HTTP error fraction for {{ $labels.destination_service_name }}
        description: Error fraction is {{ $value | humanizePercentage }}
    - alert: HighLatency
      expr: histogram_quantile(0.95, sum by (destination_service_name, destination_service_namespace,
        le) (rate(istio_request_duration_milliseconds_bucket{reporter="destination"}[5m]))) > 1000
      for: 5m
      labels:
        severity: warning
      annotations:
        summary: P95 HTTP duration exceeds1000ms
    - alert: UpstreamOverflow
      expr: sum by (destination_service_name, destination_service_namespace) (rate(istio_requests_total{response_flags=~".*UO.*",reporter="source"}[5m]))
        > 0
      for: 1m
      labels:
        severity: warning
      annotations:
        summary: Source proxy reports upstream overflow
    - alert: PlaintextMeshTraffic
      expr: sum by (source_workload, source_workload_namespace, destination_workload, destination_workload_namespace)
        (rate(istio_requests_total{connection_security_policy="none",reporter="destination"}[5m])) > 0
      for: 5m
      labels:
        severity: warning
      annotations:
summary: Observed plaintext traffic; inspect intended PeerAuthenticationエラー式は比率のままなのでhumanizePercentageが正しく表示します。宛先に届かない場合がある上流超過にはsource報告を使います。平文メトリクス欠損はSTRICT適用の証明ではありません。
Prometheus
Prometheus Operator演習設定
別途導入した互換Operator/CRDと、EKS EC2上の動作するgp3(他環境は適切なクラス)を前提とします。Operator導入、EBS作成、本番ストレージ/HA設計はしません。メモリ/CPU/ストレージ値は例です。これか既存Prometheusのどちらかを使い、収集スタックを重複させません。
下のServiceMonitor、PodMonitor、PrometheusRuleセレクターはデフォルトでこのCR名前空間の全対応リソースに一致します。そのため、旧例の不一致ラベルを持たなかったメトリクス章のmonitorも含みます。monitor選択と各monitorが検出するワークロード名前空間は別設定です。RBACはKubernetes対象検出用で、追加スクレイプ種別には別権限が必要な場合があります。
apiVersion: v1
kind: ServiceAccount
metadata:
  name: prometheus-istio
  namespace: istio-system
---
apiVersion: rbac.authorization.k8s.io/v1
kind: ClusterRole
metadata:
  name: prometheus-istio-discovery
rules:
- apiGroups:
  - ''
  resources:
  - services
  - endpoints
  - pods
  verbs:
  - get
  - list
  - watch
- apiGroups:
  - discovery.k8s.io
  resources:
  - endpointslices
  verbs:
  - get
  - list
  - watch
---
apiVersion: rbac.authorization.k8s.io/v1
kind: ClusterRoleBinding
metadata:
  name: prometheus-istio-discovery
roleRef:
  apiGroup: rbac.authorization.k8s.io
  kind: ClusterRole
  name: prometheus-istio-discovery
subjects:
- kind: ServiceAccount
  name: prometheus-istio
  namespace: istio-system
---
apiVersion: monitoring.coreos.com/v1
kind: Prometheus
metadata:
  name: istio
  namespace: istio-system
spec:
  replicas: 1
  retention: 15d
  retentionSize: 50GB
  serviceAccountName: prometheus-istio
  podMetadata:
    labels:
      monitoring-stack: istio
  serviceMonitorSelector: {}
  podMonitorSelector: {}
  ruleSelector: {}
  resources:
    requests:
      cpu: 1000m
      memory: 4Gi
    limits:
      cpu: 2000m
      memory: 8Gi
  storage:
    volumeClaimTemplate:
      spec:
        accessModes:
        - ReadWriteOnce
        resources:
          requests:
            storage: 100Gi
        storageClassName: gp3
---
apiVersion: v1
kind: Service
metadata:
  name: prometheus
  namespace: istio-system
spec:
  selector:
    monitoring-stack: istio
  ports:
  - name: http
    port: 9090
    targetPort: 9090
type: ClusterIP長期保存には宛先を導入・保護してからremote-writeをマージします。下のURLはobservabilityのVictoriaMetrics Serviceを前提とするため実backendへ合わせます。2 Prometheusレプリカは同じ対象を収集するので、remote側に意図的なHA/重複排除とreplicaラベルが必要です。replicasを2にするだけでは合計remoteメトリクスは正しくなりません。対象環境で永続化、障害動作、容量を検証します。
spec:
  remoteWrite:
  - url: http://victoria-metrics.observability.svc.cluster.local:8428/api/v1/write
    queueConfig:
      capacity: 10000
      maxShards: 5
      minShards: 1
      maxSamplesPerSend: 5000
Prometheusクエリ例
ゴールデンシグナル
レイテンシーはミリ秒です。飽和例はアクティブ接続とブレーカー状態ゲージを示します。自動使用率分母用の標準cx_maxはありません。
# 1. Latency
histogram_quantile(0.95,
  sum(rate(istio_request_duration_milliseconds_bucket{
    reporter="destination"
  }[5m])) by (destination_service_name, destination_service_namespace, le)
)

# 2. Traffic
sum(rate(istio_requests_total{reporter="destination"}[1m])) by (destination_service_name, destination_service_namespace)

# 3. Errors (error rate)
sum(rate(istio_requests_total{response_code=~"5..", reporter="destination"}[5m])) by (destination_service_name, destination_service_namespace)
/
sum(rate(istio_requests_total{reporter="destination"}[5m])) by (destination_service_name, destination_service_namespace)
* 100

# 4. Saturation
envoy_cluster_upstream_cx_active
envoy_cluster_circuit_breakers_default_cx_open
カスタムダッシュボード作成
GrafanaダッシュボードJSONテンプレート
インポート/ファイル設定用のclassicオブジェクトです。既存UID prometheusを指定します。全パネルがnamespace/serviceを絞り、送信元別表はsource namespaceも保持します。
{
  "title": "Custom Istio Service Dashboard",
  "tags": [
    "istio",
    "custom"
  ],
  "timezone": "browser",
  "version": 1,
  "panels": [
    {
      "id": 1,
      "title": "Request Rate",
      "type": "timeseries",
      "gridPos": {
        "h": 8,
        "w": 12,
        "x": 0,
        "y": 0
      },
      "targets": [
        {
          "expr": "sum(rate(istio_requests_total{reporter=\"destination\",destination_service_namespace=\"$namespace\",destination_service_name=\"$service\"}[5m])) by (response_code)",
          "legendFormat": "{{ response_code }}",
          "refId": "A",
          "datasource": {
            "type": "prometheus",
            "uid": "prometheus"
          }
        }
      ],
      "fieldConfig": {
        "defaults": {
          "color": {
            "mode": "palette-classic"
          },
          "custom": {
            "drawStyle": "line",
            "lineInterpolation": "linear",
            "fillOpacity": 10
          },
          "unit": "reqps"
        }
      },
      "datasource": {
        "type": "prometheus",
        "uid": "prometheus"
      }
    },
    {
      "id": 2,
      "title": "P95 Latency",
      "type": "gauge",
      "gridPos": {
        "h": 8,
        "w": 6,
        "x": 12,
        "y": 0
      },
      "targets": [
        {
          "expr": "histogram_quantile(0.95, sum(rate(istio_request_duration_milliseconds_bucket{reporter=\"destination\",destination_service_namespace=\"$namespace\",destination_service_name=\"$service\"}[5m])) by (le))",
          "refId": "A",
          "datasource": {
            "type": "prometheus",
            "uid": "prometheus"
          }
        }
      ],
      "fieldConfig": {
        "defaults": {
          "unit": "ms",
          "thresholds": {
            "mode": "absolute",
            "steps": [
              {
                "value": 0,
                "color": "green"
              },
              {
                "value": 500,
                "color": "yellow"
              },
              {
                "value": 1000,
                "color": "red"
              }
            ]
          },
          "max": 2000
        }
      },
      "options": {
        "showThresholdLabels": true,
        "showThresholdMarkers": true
      },
      "datasource": {
        "type": "prometheus",
        "uid": "prometheus"
      }
    },
    {
      "id": 3,
      "title": "Error Rate",
      "type": "stat",
      "gridPos": {
        "h": 8,
        "w": 6,
        "x": 18,
        "y": 0
      },
      "targets": [
        {
          "expr": "sum(rate(istio_requests_total{reporter=\"destination\",destination_service_namespace=\"$namespace\",destination_service_name=\"$service\", response_code=~\"5..\"}[5m])) / sum(rate(istio_requests_total{reporter=\"destination\",destination_service_namespace=\"$namespace\",destination_service_name=\"$service\"}[5m])) * 100",
          "refId": "A",
          "datasource": {
            "type": "prometheus",
            "uid": "prometheus"
          }
        }
      ],
      "fieldConfig": {
        "defaults": {
          "unit": "percent",
          "thresholds": {
            "mode": "absolute",
            "steps": [
              {
                "value": 0,
                "color": "green"
              },
              {
                "value": 1,
                "color": "yellow"
              },
              {
                "value": 5,
                "color": "red"
              }
            ]
          }
        }
      },
      "datasource": {
        "type": "prometheus",
        "uid": "prometheus"
      }
    },
    {
      "id": 4,
      "title": "Request by Source",
      "type": "table",
      "gridPos": {
        "h": 8,
        "w": 12,
        "x": 0,
        "y": 8
      },
      "targets": [
        {
          "expr": "sum(rate(istio_requests_total{reporter=\"destination\",destination_service_namespace=\"$namespace\",destination_service_name=\"$service\"}[5m])) by (source_workload, source_workload_namespace, response_code)",
          "format": "table",
          "instant": true,
          "refId": "A",
          "datasource": {
            "type": "prometheus",
            "uid": "prometheus"
          }
        }
      ],
      "transformations": [
        {
          "id": "organize",
          "options": {
            "excludeByName": {
              "Time": true
            },
            "indexByName": {
              "source_workload": 0,
              "response_code": 1,
              "Value": 2
            },
            "renameByName": {
              "source_workload": "Source",
              "response_code": "Code",
              "Value": "RPS"
            }
          }
        }
      ],
      "datasource": {
        "type": "prometheus",
        "uid": "prometheus"
      }
    },
    {
      "id": 5,
      "title": "Upstream Overflow and Retry Exhaustion",
      "type": "timeseries",
      "gridPos": {
        "h": 8,
        "w": 12,
        "x": 12,
        "y": 8
      },
      "targets": [
        {
          "expr": "sum(rate(istio_requests_total{reporter=\"source\",destination_service_namespace=\"$namespace\",destination_service_name=\"$service\", response_flags=~\".*UO.*\"}[5m]))",
          "legendFormat": "Upstream overflow",
          "refId": "A",
          "datasource": {
            "type": "prometheus",
            "uid": "prometheus"
          }
        },
        {
          "expr": "sum(rate(istio_requests_total{reporter=\"source\",destination_service_namespace=\"$namespace\",destination_service_name=\"$service\", response_flags=~\".*URX.*\"}[5m]))",
          "legendFormat": "Retry/connect attempts exhausted",
          "refId": "B",
          "datasource": {
            "type": "prometheus",
            "uid": "prometheus"
          }
        }
      ],
      "datasource": {
        "type": "prometheus",
        "uid": "prometheus"
      }
    }
  ],
  "templating": {
    "list": [
      {
        "name": "namespace",
        "type": "query",
        "query": "label_values(istio_requests_total, destination_service_namespace)",
        "datasource": {
          "type": "prometheus",
          "uid": "prometheus"
        },
        "current": {
          "selected": true,
          "text": "default",
          "value": "default"
        },
        "multi": false
      },
      {
        "name": "service",
        "type": "query",
        "query": "label_values(istio_requests_total{destination_service_namespace=\"$namespace\"}, destination_service_name)",
        "datasource": {
          "type": "prometheus",
          "uid": "prometheus"
        },
        "current": {},
        "multi": false
      }
    ]
  },
  "time": {
    "from": "now-1h",
    "to": "now"
  },
  "refresh": "30s",
  "uid": "custom-istio-service"
}
ダッシュボードファイルのプロビジョニング
完全JSONをcustom-istio-service.jsonとして保存します。省略記号やHTTP APIの{ "dashboard": ... }ラッパーを入れないでください。
kubectl create configmap grafana-dashboard-custom-istio \
  --from-file=custom-istio-service.json -n observability \
--dry-run=client -o yaml | kubectl apply -f -apiVersion: v1
kind: ConfigMap
metadata:
name: grafana-istio-provider
namespace: observability
data:
istio.yaml: |
apiVersion: 1
providers:
- name: istio
orgId: 1
folder: Istio
type: file
disableDeletion: false
editable: false
options:
path: /var/lib/grafana/istio-dashboards既存Grafana Deployment/Helm valuesへマウントをマージし、イメージ、認証情報、ストレージ、プローブ、他コンテナを保持します。コンテナ名は実Deploymentと一致する必要があります。subPathでマウントしたproviderファイルを変える場合は管理されたPodロールアウトが必要です。設定済みdashboard sidecarならそのチャート設定に従います。grafana_dashboardラベルだけではローダーを導入/設定しません。
spec:
  template:
    spec:
      containers:
      - name: grafana
        volumeMounts:
        - name: istio-dashboards
          mountPath: /var/lib/grafana/istio-dashboards
          readOnly: true
        - name: istio-provider
          mountPath: /etc/grafana/provisioning/dashboards/istio.yaml
          subPath: istio.yaml
          readOnly: true
      volumes:
      - name: istio-dashboards
        configMap:
          name: grafana-dashboard-custom-istio
      - name: istio-provider
        configMap:
          name: grafana-istio-provider
ダッシュボード統合
Kiali → Grafanaとトレースリンク
前の例へマージする任意Kiali CR断片です。internal_urlはKialiサーバー、external_urlはユーザーブラウザーから到達可能である必要があります。KialiはGrafana APIへ認証し正確なdashboard名を見つける必要があります。対応Secret参照で認証情報を設定し、該当する非公開CAを信頼します。断片は認証情報や公開エンドポイントを作りません。
spec:
  external_services:
    grafana:
      enabled: true
      internal_url: http://grafana.observability.svc.cluster.local:3000
      external_url: https://grafana.example.com
      datasource_uid: prometheus
      dashboards:
      - name: Istio Service Dashboard
        variables:
          datasource: var-datasource
          service: var-service
      - name: Istio Workload Dashboard
        variables:
          datasource: var-datasource
          namespace: var-namespace
          workload: var-workload
トレース章のJaeger HTTP queryでは、現設定はexternal_services.tracing下で、port16686にはuse_grpc: falseです。有効化前にbackend/API互換性と認証を検証します。OAuth2注入はHTTPだけに対応します。Jaeger/Tempo統合は任意の別設定です。Kialiカスタムdashboardは独自スキーマで、Grafana JSONをexternal_services.custom_dashboardsリストに入れられません。
spec:
  external_services:
    tracing:
      enabled: true
      provider: jaeger
      internal_url: http://jaeger-query.observability.svc.cluster.local:16686
      external_url: https://jaeger.example.com
      use_grpc: false
Grafana → Jaegerリンク
既存Prometheusデータソースへエグゼンプラー対応をマージします。nameは実エグゼンプラーラベル(通常trace_id)、jaegerは既存UIDと一致する必要があります。エグゼンプラーを生成するものではありません。
# Prometheus datasource configuration
apiVersion: v1
kind: ConfigMap
metadata:
  name: grafana-datasources
data:
  prometheus.yaml: |
    apiVersion: 1
    datasources:
    - name: Prometheus
      type: prometheus
      jsonData:
        exemplarTraceIdDestinations:
        - datasourceUid: jaeger
          name: trace_id
Loki → Tempo統合
既存Lokiへ以下のフィールドをマージします。実trace_idログフィールド、トレース有効化、同じトレースのTempo保持が必要です。request_idはtrace IDではありません。
# Loki datasource configuration
apiVersion: 1
datasources:
- name: Loki
  type: loki
  jsonData:
    derivedFields:
    - datasourceUid: tempo
      matcherRegex: '"trace_id"\s*:\s*"([0-9a-fA-F]{32})"'
      name: TraceID
      url: '$${__value.raw}'
      urlDisplayLabel: 'View Trace'
ベストプラクティス
1. ダッシュボードの整理
Grafana Folder Structure:
├── Istio/
│   ├── Overview/
│   │   ├── Istio Mesh Dashboard
│   │   └── Istio Control Plane Dashboard
│   ├── Services/
│   │   ├── Istio Service Dashboard
│   │   └── Custom Service Dashboards
│   ├── Workloads/
│   │   └── Istio Workload Dashboard
│   ├── Gateways/
│   │   └── Istio Gateway Dashboard
│   └── Logs/
│       ├── Loki Istio Dashboard (#14876)
│       └── Access Log Analysis
2. 変数の利用
全ダッシュボードで一貫した変数を使います。
{
  "templating": {
    "list": [
      {"name": "datasource", "type": "datasource"},
      {"name": "namespace", "type": "query"},
      {"name": "service", "type": "query"},
      {"name": "workload", "type": "query"},
      {"name": "interval", "type": "interval", "auto": true}
    ]
  }
}
3. アラート管理
- 段階別通知: Critical(PagerDuty)→ Warning(Slack)→ Info(Email)
- グループ化: service、namespaceでまとめる
- 抑制ルール: 保守中に通知をミュート
4. 性能最適化
# Grafana configuration
[dashboards]
min_refresh_interval = 10s

[panels]
disable_sanitize_html = false

[dataproxy]
timeout = 30クエリ最適化:
- Recording Rulesで頻繁なクエリを事前計算
- Prometheus rate窓に
$__rate_intervalを使用。$__intervalはstep/バケットを制御 - 毎秒レートには
rate()、期間合計にはincrease()。両方ともカウンターリセットを考慮
5. アクセス制御
以下は匿名アクセス/サインアップを無効にし、デフォルト組織ロールViewerを割り当てます。完全なリソース別RBACではありません。公開前にKubernetes Secretと文書化された仕組みで既存環境の管理者認証情報を設定します。このConfigMap単体はパスワードを設定しません。
# Grafana authentication and default organization role
apiVersion: v1
kind: ConfigMap
metadata:
  name: grafana-config
data:
  grafana.ini: |
    [auth]
    disable_login_form = false

    [auth.anonymous]
    enabled = false

    [auth.basic]
    enabled = true

    [users]
    allow_sign_up = false
    auto_assign_org = true
    auto_assign_org_role = Viewer

    [security]
    admin_user = admin
6. バックアップと復旧
設定済みdashboard/datasourceファイルをバックアップし、UI管理dashboardは対応UI/APIでエクスポートします。完全復旧にはアプリ整合性のある手順によるGrafana DB、設定、プラグインも必要です。grafana-cli admin export-dashboardコマンドはありません。
Prometheusスナップショットはpromtool tsdb snapshotでなく管理HTTP APIを使います。保護された保守エンドポイントで意図的に有効化する必要があります。選択Podをlocalhostへforwardした後の保守例です。
curl -fsS -X POST http://localhost:9090/api/v1/admin/tsdb/snapshot応答はサーバーデータディレクトリ下のスナップショット位置を返します。完了したものをバックアップ先へコピーしてください。同じディスク上では独立バックアップではありません。復元、保持、remote-write復旧を別々に検証します。文書監査ではバックアップ/デプロイ操作を実行していません。
参考資料
公式ドキュメント
コミュニティダッシュボード
- Istio用Grafana Loki Dashboard(#14876)
- Istio Workload Dashboard(#7630)
- Istio Performance Dashboard(#11829)
- Istio Wasm Extension Dashboard(#13277)