KubescapeによるSecurity Posture Management
最終更新: September 13, 2026 検証ベースライン: CLI 4.0.14およびOperator chart 1.40.4。chartのscanner imageはCLIとは別の4.0.13です。Policy hashはexample directoryに記録されています。
KubescapeはKubernetes設定と、選択されたimage/runtimeデータを評価します。scanの成功はsecurityの保証でもcompliance認定でもありません。利用できないcoverageは別途特定する必要があります。 このガイドは、local YAML、policy bundle、実際のCLI、およびchart renderingで確認しました。live cluster scan、node-agent installation、registry image/DB scan、SaaS送信は実施していません。
概要
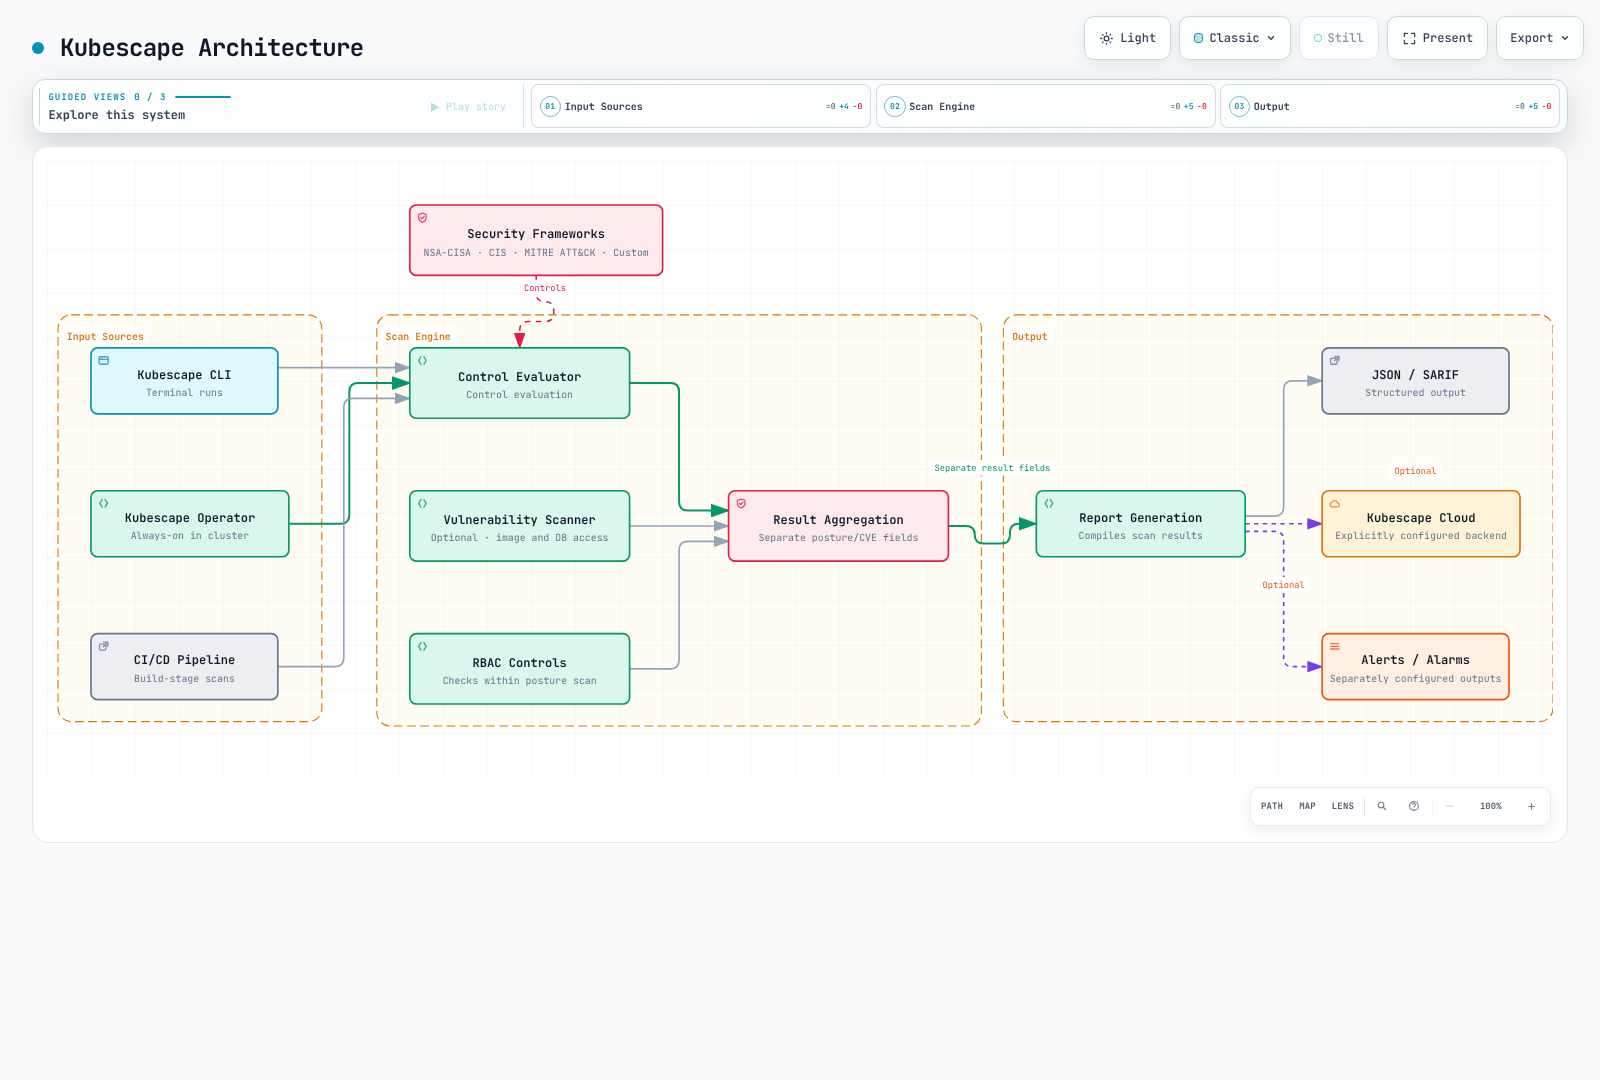
Kubescapeは2022年12月13日にCNCFへ参加し、2025年1月13日にIncubatingとなりました。以前のSandboxの説明および古いtool maturity比較表は、現在のガイダンスではありません。
CLIは明示的なfileまたはcluster scanを実行します。Operatorは有効なcapabilityに従い、continuous/scheduledな動作を提供します。Configuration control、RBAC analysis、image CVE、runtime detectionにはそれぞれ異なるscopeがあります。kube-benchのnode/CIS check、Polarisのworkload policy、Trivyのimage/configuration scanは、包括的な優劣の主張ではなく、version管理された要件と比較してください。
インストール
CLIのインストール
公式4.0.14 releaseからOS/CPUに対応するassetをdownloadし、そのchecksumを検証します。このLinux AMD64の例では確認済みのarchive hashを固定しています。ARM64には異なるarchive/hashが必要です。
curl --fail --location \
  https://github.com/kubescape/kubescape/releases/download/v4.0.14/kubescape_4.0.14_linux_amd64.tar.gz \
  --output kubescape.tgz
printf '%s  %s\n' '1d253b70f88e80b74f68af73ccd422f897381468300be7cc486fdd656d907a40' kubescape.tgz | sha256sum --check
tar -xzf kubescape.tgz kubescape
./kubescape version
./kubescape scan --help
Homebrew/Krewまたはその他のinstallerを使用する際は、実際のpackage versionを確認してください。installerの実行とkubeconfigの公開範囲を、意図したscopeに制限してください。kubescape scanでfile targetを省略すると、current clusterをscanする場合があります。
Helm Operatorのインストール
example directoryをdownloadし、examples/security/kubescapeからこれらのcommandを実行します。このprofileはposture checkとmetricsに焦点を当て、node/image/runtime/remediation capabilityを明示的に無効化します。
helm repo add kubescape https://kubescape.github.io/helm-charts
helm repo update kubescape
helm upgrade --install kubescape kubescape/kubescape-operator \
  --version 1.40.4 --namespace kubescape --create-namespace \
--values operator-values.yamlclusterName: documentation-cluster
defaultFrameworks:
- nsa
- mitre
capabilities:
continuousScan: enable
configurationScan: enable
nodeScan: disable
nodeSbomGeneration: disable
vulnerabilityScan: disable
relevancy: disable
runtimeObservability: disable
networkPolicyService: disable
networkEventsStreaming: disable
runtimeDetection: disable
nodeProfileService: disable
admissionController: disable
httpDetection: disable
seccompProfileService: disable
prometheusExporter: enable
riskAcceptance: disable
remediation: disable
manageWorkloads: disable
global:
enableClusterWideSecretAccess: false
persistence:
storageClass: gp3
kubescapeScheduler:
scanSchedule: 0 8 * * *gp3 StorageClass/CSI driverを準備し、namespace、RBAC、CRD、aggregated APIの可用性を検証してください。EKS Auto Modeと通常のEBS CSI StorageClassでは、異なるprovisionerを使用する場合があります。Helm renderingはinstallation、persistence、またはscan成功を保証しません。
credentials.cloudSecretはaccount IDではなく、既存のSecret名です。SaaSが必要な場合は、backend/account/accessKey/data scopeを明示的に設定し、認可してください。CLIの--submitは送信を要求します。local exampleでは--keep-localと分離したcacheを使用します。host privilege、kernel/BTF、対応するnode typeを確認した後、node/runtime featureを別途有効化してください。
Security Framework
FrameworkとControl
Framework名とcontrol数はpolicy bundleに依存します。確認したdownloadにはNSA、MITRE、SOC2、ArmoBest、DevOpsBest、AllControls、およびversion付きCIS frameworkが含まれていました。NSAには26個のcontrolが含まれており、すべてがlocal Podに適用できるわけではありません。
kubescape list frameworks
kubescape list controls --framework NSA
kubescape list controls --framework NSA --search container確認したbundleの例の名前には、cis-v1.12.0およびcis-eks-t1.8.0があります。cis-v1.23またはcisが汎用aliasであると想定しないでください。Policy updateはcoverage/scoreを変更します。binary versionとpolicy hashを一緒に記録してください。
| Control ID | 確認したbundle名 |
|---|---|
| C-0004 | Resources memory limit and request |
| C-0009 | Resource limits |
| C-0013 | Non-root containers |
| C-0016 | Allow privilege escalation |
| C-0034 | Automatic mapping of service account |
| C-0035 | Administrative Roles |
| C-0036 | Validate admission controller (validating) |
| C-0039 | Validate admission controller (mutating) |
| C-0057 | Privileged container |
C-0036/0039は、wildcard-RBAC/risky-ServiceAccount controlではありません。Severityもbundleに依存します。確認したC-0057はHighであり、常にCriticalではありません。
Custom Framework
--use-fromはlocal policy objectをloadします。YAML名と解決されていないcontrol ID listが、実行可能なframeworkであるとは限りません。exampleのpolicies/nsa.jsonは、license、provenance、SHA recordを備えたテスト済みbundleです。kubescape policy initやkubescape policy testなど、現在のCLI featureを使用して新しいRego controlを作成・テストし、その後organizational requirementをレビューしてください。
CLI Scanning
ClusterとLocal Inputの比較
# This accesses the current cluster; check authorization and scope first.
kubescape scan framework nsa --include-namespaces production
# Explicit local-file scan:
kubescape scan framework nsa secure-pod.yaml \
  --use-from policies/nsa.json --controls-config policies/controls-inputs.json \
  --exceptions no-exceptions.json --keep-local \
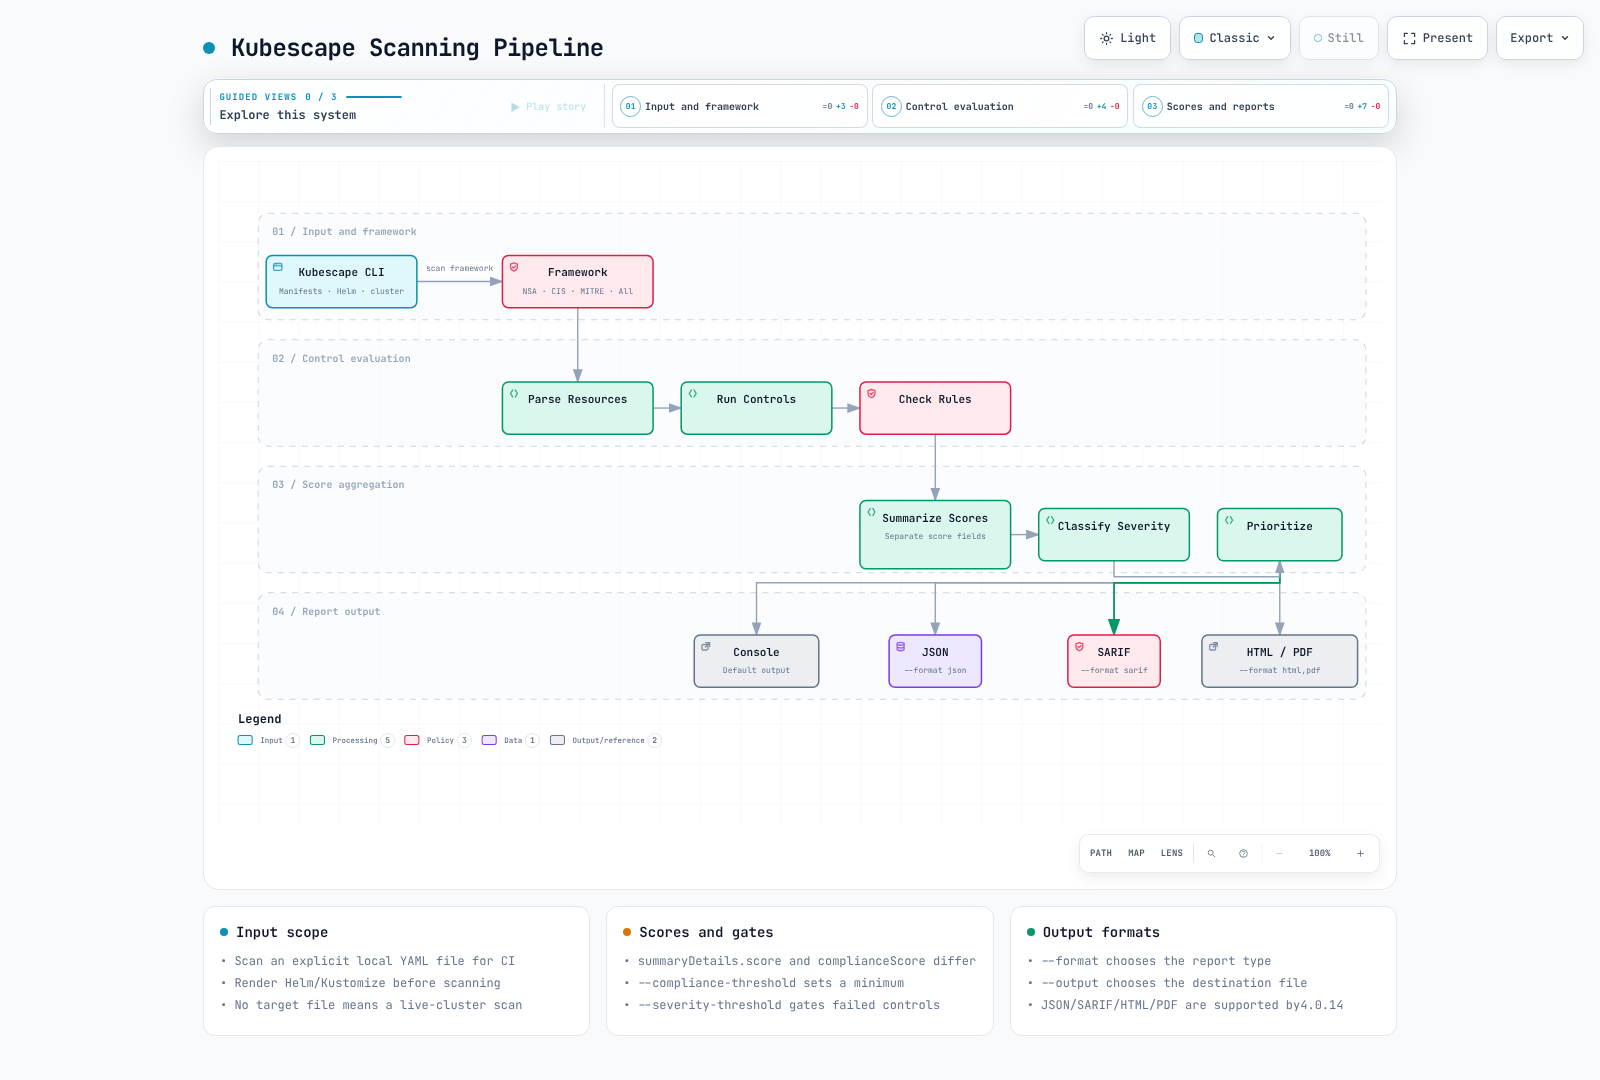
--format json --output report.json--format/-fはformatを選択し、--output/-oはfile名を指定します。-o json > report.jsonはJSON outputを選択しません。Version 4.0.14はJSON/SARIF/HTML/PDF/JUnit/gitlab-sastなどのformatをサポートします。受信側toolが想定するものを選択してください。
有効なvalueを明示するため、scanの前にHelm/Kustomizeをlocalでrenderしてください。Local checkはAPI defaulting、admission、IAM authorization、network behaviorを再現しません。確認したCLIでは、--include-api-audit、--custom-framework、--sort-byは不明でした。scan rbacを現在の独立したsubcommandとして提示しないでください。
実際のLocal Result
insecure-pod.yamlは、deployment recipeではなくsynthetic scan fixtureです。存在しないrunAsRootではなく、実際のprivileged/runAsUser fieldを使用します。secure-pod.yamlもconfigurationのみを示します。実際にdeploymentする前にapplication imageを置き換えてください。
| Local input | Compliance | score | 結果 |
|---|---|---|---|
| Insecure Pod | 55 | 62.5 | High failure |
| Secure Pod | 95 | 6.818182 | High gateはpassするが、すべてのcontrolがpassするわけではない |
これらのvalueは、添付されたpolicy snapshotと1つのlocal Podに適用されます。cluster securityやexploitabilityを測定するものではありません。
ImageおよびRBAC Analysis
kubescape scan image IMAGEでimage scanを明示的に要求してください。CLI 4.0.14はsource dependencyでGrype 0.104.1およびSyft 1.42.3を使用します。Operatorのkubevuln componentは別途version管理されています。registry credential、platform、database freshness、scan errorを検証してください。Host scanはimage scanとは異なり、追加のhost access/resource creationを必要とする場合があります。
RBAC controlは、認可されたAPI scope内で収集したRole/Bindingを評価します。RoleBindingはそのnamespace内でaccessを付与し、すべてのnamespaceに付与するわけではありません。Static analysisだけでは、未使用のpermission、外部IAM authorization、またはすべての有効なaccess pathを確立できません。
Operator Mode(In-Cluster)
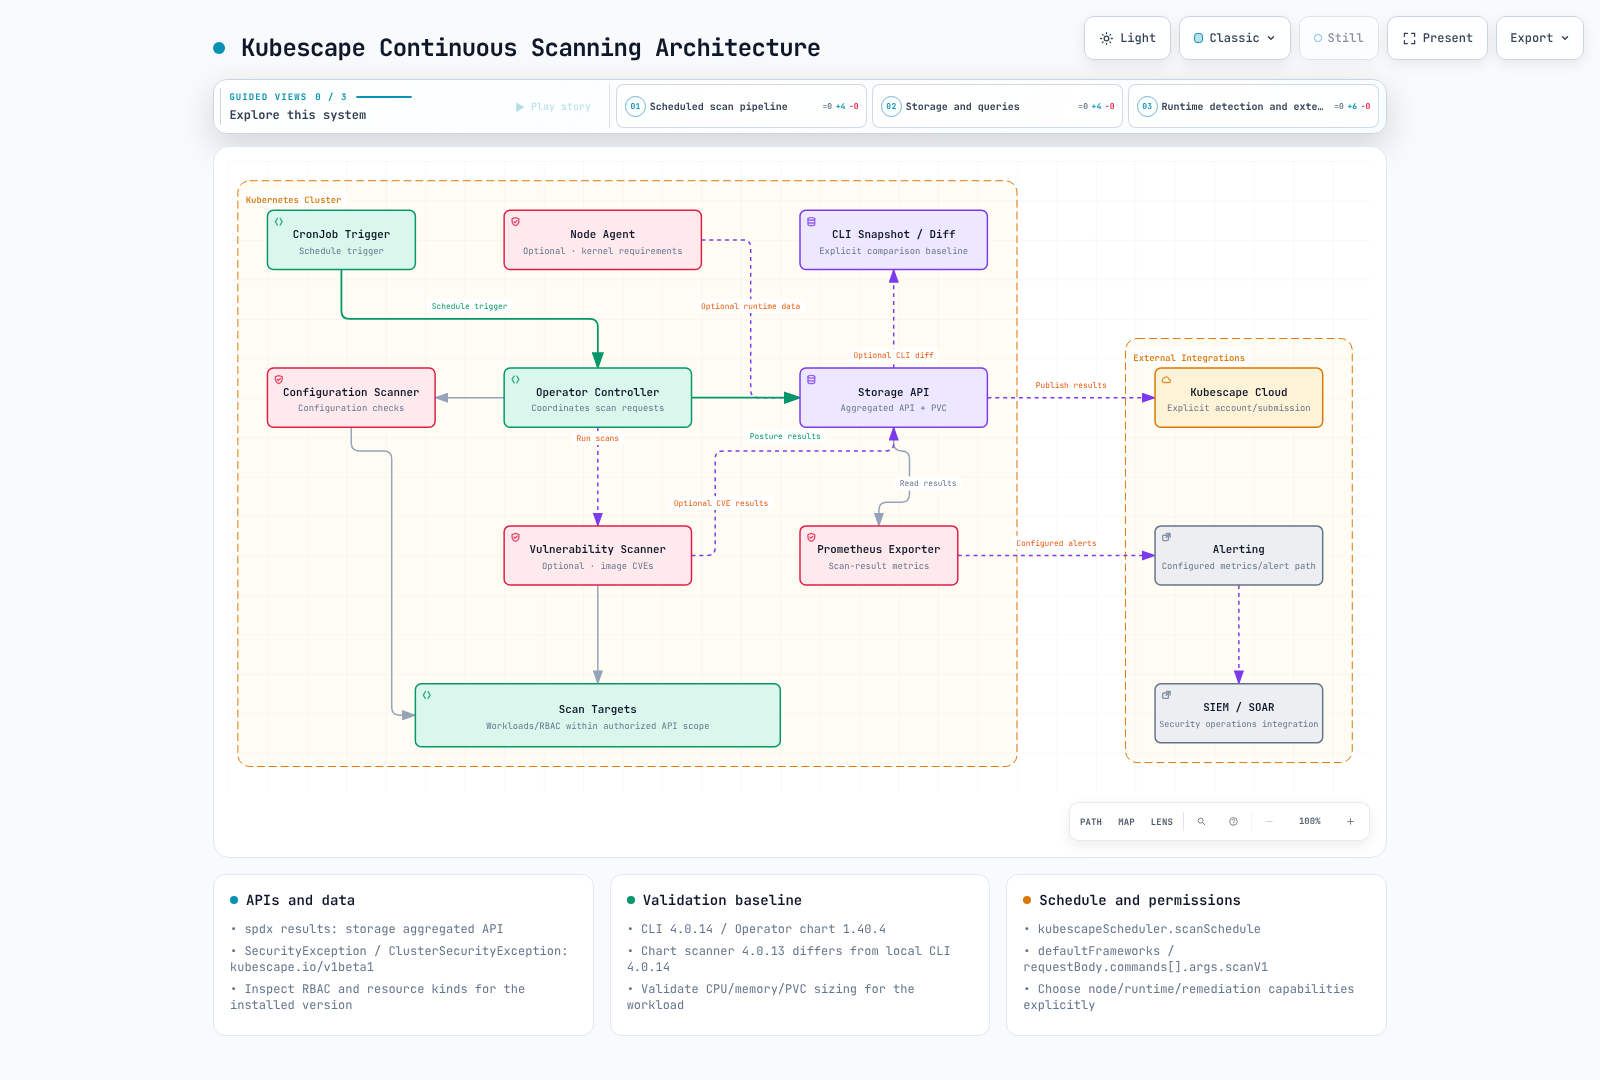
chartのkubescapeScheduler.scanScheduleおよびrequestBody.commands[].args.scanV1 fieldを使用してください。defaultFrameworksはtargetのないrequestにdefaultを提供し、明示的なtargetNamesが優先されます。scanScheduleを含む任意のConfigMapを作成しても、controllerがそれを使用することは保証されません。
spdx.softwarecomposition.kubescape.io/v1beta1のresultは、通常のすべてのCRDではなくstorage componentのaggregated APIによって提供されます。個別のCRDにはSecurityException、ClusterSecurityException、OperatorCommandがあります。resultをqueryする前に、実際の名前/scopeを確認してください。
kubectl get apiservices v1beta1.spdx.softwarecomposition.kubescape.io
kubectl api-resources --api-group=spdx.softwarecomposition.kubescape.io
kubectl get pods,pvc -n kubescape
古いScanSchedule、VulnerabilityScanConfig、ThreatDetectionConfig、AcceptedRisk、ScanConfigurationのexampleを、このchartによってinstallされるAPIとして提示しないでください。Node-agent profile/detectionには、選択したimageに対応する実際のAPI/capabilityを使用する必要があります。有効なconfigurationは、すべてのnodeで正常なcollectionまたはdetectionが行われている証明ではありません。
Risk Scoring
summaryDetails.complianceScoreとsummaryDetails.scoreは異なるaggregateです。complianceが高いほどpassしたcheckが多いことを示します。risk scoreは同じvalueでも、単純に100-complianceでもありません。架空のseverity weightやresponse SLAを、汎用的なKubescape formulaとして提示しないでください。
jq '{compliance: .summaryDetails.complianceScore, risk: .summaryDetails.score,
failed: [.summaryDetails.controls[] | select(.status == "failed") | {controlID, name, severity}]}' report.json--compliance-thresholdは最低compliance scoreとして、--severity-thresholdはfailed-control severityに使用してください。local score 55はthreshold 55でexit 0、56でexit 1を返しました。--min-severityはoutputをfilterしますが、現在のgate calculationの代わりにはなりません。
Version 4.0.14はdeprecated compatibility flagとして--fail-thresholdを受け付けますが、そのvalueを無視します。 テストでは、--fail-threshold 0のみを指定すると、failed findingがあってもexit 0が返りました。その無効なflagを、--scan-images/--skip-controlsのように引き続き処理されるoptionや、本当に不明なflagと区別してください。
CI/CD Integration
共通Security Gate
#!/usr/bin/env bash
# Scan explicit local manifests with an isolated Kubernetes/client configuration.
set -euo pipefail
if [[ $# -ne 2 ]]; then
  printf 'Usage: %s LOCAL_MANIFEST OUTPUT_JSON\n' "$0" >&2
  exit 2
fi
manifest_path=$1
report_path=$2
if [[ ! -f $manifest_path ]]; then
  printf 'Expected an existing local manifest file: %s\n' "$manifest_path" >&2
  exit 2
fi
# An absolute operand cannot be parsed as a flag such as --help.
manifest_path="$(cd -- "$(dirname -- "$manifest_path")" && pwd)/$(basename -- "$manifest_path")"
script_dir=$(cd -- "$(dirname -- "${BASH_SOURCE[0]}")" && pwd)
: "${KUBESCAPE_BIN:=kubescape}"
: "${COMPLIANCE_MINIMUM:=90}"
: "${SEVERITY_LIMIT:=high}"
umask 077
scan_temp_dir=$(mktemp -d "${TMPDIR:-/tmp}/kubescape-local.XXXXXX")
trap 'rm -rf -- "$scan_temp_dir"' EXIT
mkdir -- "$scan_temp_dir/cache"
cat > "$scan_temp_dir/kubeconfig" <<'YAML'
apiVersion: v1
kind: Config
clusters: []
contexts: []
users: []
current-context: ''
YAML
# Block inherited in-cluster discovery as well as kubeconfig and cached backend state.
env -u KUBERNETES_SERVICE_HOST -u KUBERNETES_SERVICE_PORT -u KUBERNETES_PORT -u KUBERNETES_MASTER \
  KUBECONFIG="$scan_temp_dir/kubeconfig" KS_CACHE_DIR="$scan_temp_dir/cache" \
  "$KUBESCAPE_BIN" --cache-dir "$scan_temp_dir/cache" scan framework nsa "$manifest_path" \
  --kubeconfig "$scan_temp_dir/kubeconfig" --host-scan=false \
  --use-from "$script_dir/policies/nsa.json" \
  --controls-config "$script_dir/policies/controls-inputs.json" \
  --exceptions "$script_dir/no-exceptions.json" \
  --honor-inline-exceptions=false \
  --keep-local \
  --compliance-threshold "$COMPLIANCE_MINIMUM" \
  --severity-threshold "$SEVERITY_LIMIT" \
  --format json --output "$report_path"
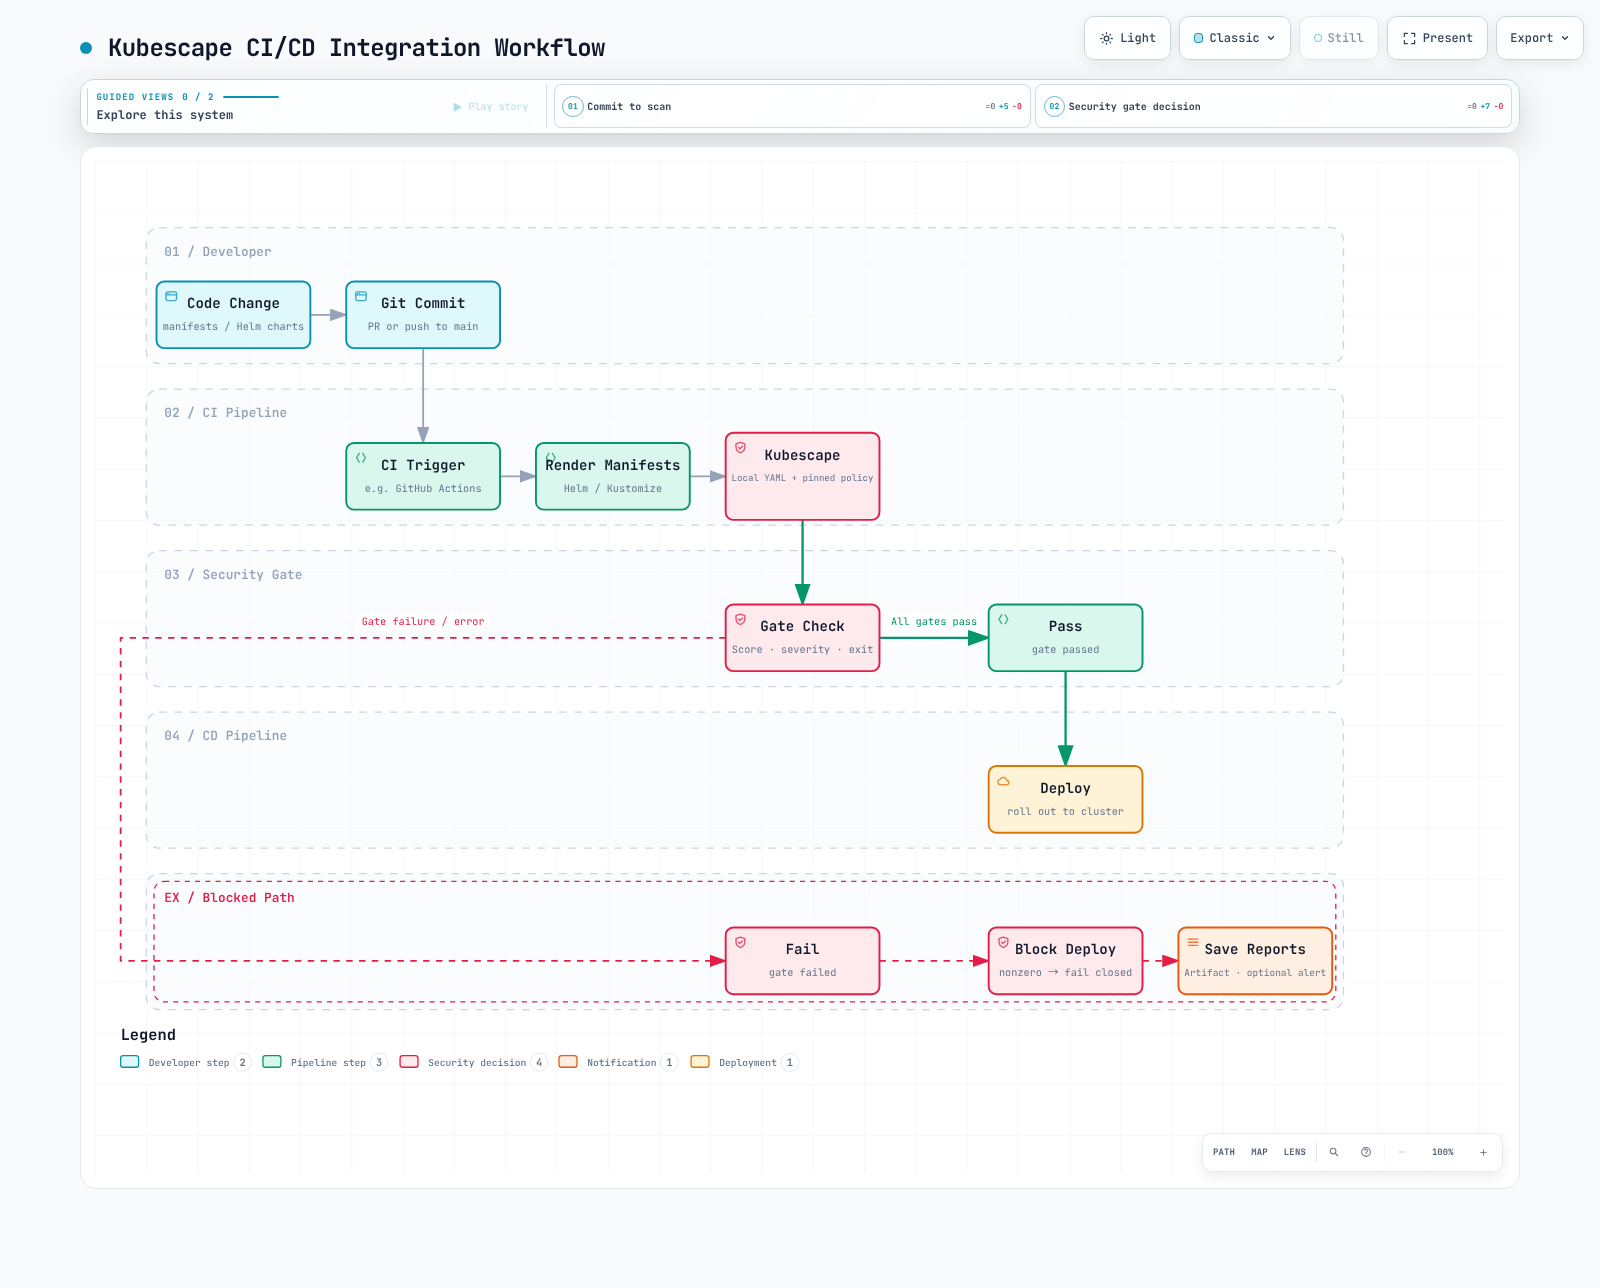
CI gateはskip-control annotationを無視し、空のkubeconfigとfresh cacheを使用し、継承されたin-cluster discoveryをclearします。--keep-localだけではKubernetes API accessを防止できません。hostile loopback API contextを用いた5つのnative testでは、requestは0件で、想定どおりのfailure/success codeが生成されました。
input不足、scan error、threshold failureはnonzeroを返します。continue-on-errorまたは|| trueで隠さないでください。report uploadはfailure後に実行できますが、successを決定するものではありません。controlを除外すると評価対象のdenominatorが変わるため、記録する必要があります。
GitHub Actions
検証済みworkflowはbinary/checksumを固定し、local policy snapshotでk8s/rendered.yamlのみをscanします。projectは先にそのfileを生成する必要があります。存在しない場合、jobはfailureになります。permissionはcontents:readであり、PR commentやSaaS送信は行いません。
GitLabおよびJenkins
どちらのsystemでも、同じscan-manifests.sh exit codeを保持してreportをarchiveできます。汎用のKubescape JSONはGitLab SASTやCode Quality schemaではありません。統合SAST reportでは、現在の--format gitlab-sast outputを受信側versionで検証してください。JenkinsのreadJSON/publishHTMLにはpluginが必要です。pipelineが生成していないHTML fileをpublishしないでください。
EKS固有ガイド
Kubernetes manifest scanでは、EKS control-plane configuration、IAM、access entry、Pod Identity/IRSA、node policyを完全には検証できません。aws-authはlegacy authentication pathです。現在のauthentication modeとaccess entryを調査してください。system:mastersまたはemergency IAM userはleast-privilegeのexampleではありません。
C-0034はservice account tokenのautomountをcheckするものであり、完全なIRSA trust/aud/sub/IAM policyを対象とするものではありません。projectされたSTS tokenと自動のKubernetes API token mountingを区別してください。実際のworkload identityと許可されたAWS operationを別途検証してください。
host-scanningおよびremediation permission/mutationを有効化する前にレビューしてください。exampleではcluster-wide Secret accessとremediationを無効化していますが、operatorは引き続きinstallationに必要なscanner/operator/storage RBACを調査する必要があります。
Control Exception Handling
CLI Exception
[
  {
    "name": "documentation-privileged-exception",
    "policyType": "postureExceptionPolicy",
    "actions": [
      "alertOnly"
    ],
    "resources": [
      {
        "designatorType": "Attributes",
        "attributes": {
          "namespace": "demo-app",
          "kind": "Pod",
          "name": "insecure-example"
        }
      }
    ],
    "posturePolicies": [
      {
        "controlID": "C-0057"
      }
    ]
  }
]これはCLIが使用するJSON arrayであり、ConfigMap wrapperではありません。テスト済みのalertOnly exceptionは、failureとcompliance 55を維持したままC-0057をacknowledgedとしました。--exclude-controls C-0057はcontrolを評価から除外し、denominatorとscoreを変更しました。exceptionはremediationではありません。
In-Cluster Exception
apiVersion: kubescape.io/v1beta1
kind: SecurityException
metadata:
  name: documentation-privileged-exception
  namespace: demo-app
spec:
  author: documentation-security-team
  reason: Synthetic scan example; replace with an approved owner and justification.
  expiresAt: '2026-09-30T00:00:00Z'
  match:
    resources:
      - apiGroup: ''
        kind: Pod
        name: insecure-example
  posture:
    - controlID: C-0057
action: alert_only現在のAPIはkubescape.io/v1beta1のSecurityException/ClusterSecurityExceptionです。承認済みpolicyに従ってnamespace scope、match、posture action、expiry、ownershipを設定してください。schemaのsuccessは、controller enforcement、RBAC、CEL behaviorを保証しません。CLIのalertOnlyはCRDのalert_onlyとは異なります。exception処理のために架空のignore annotationに依存しないでください。
ベストプラクティス
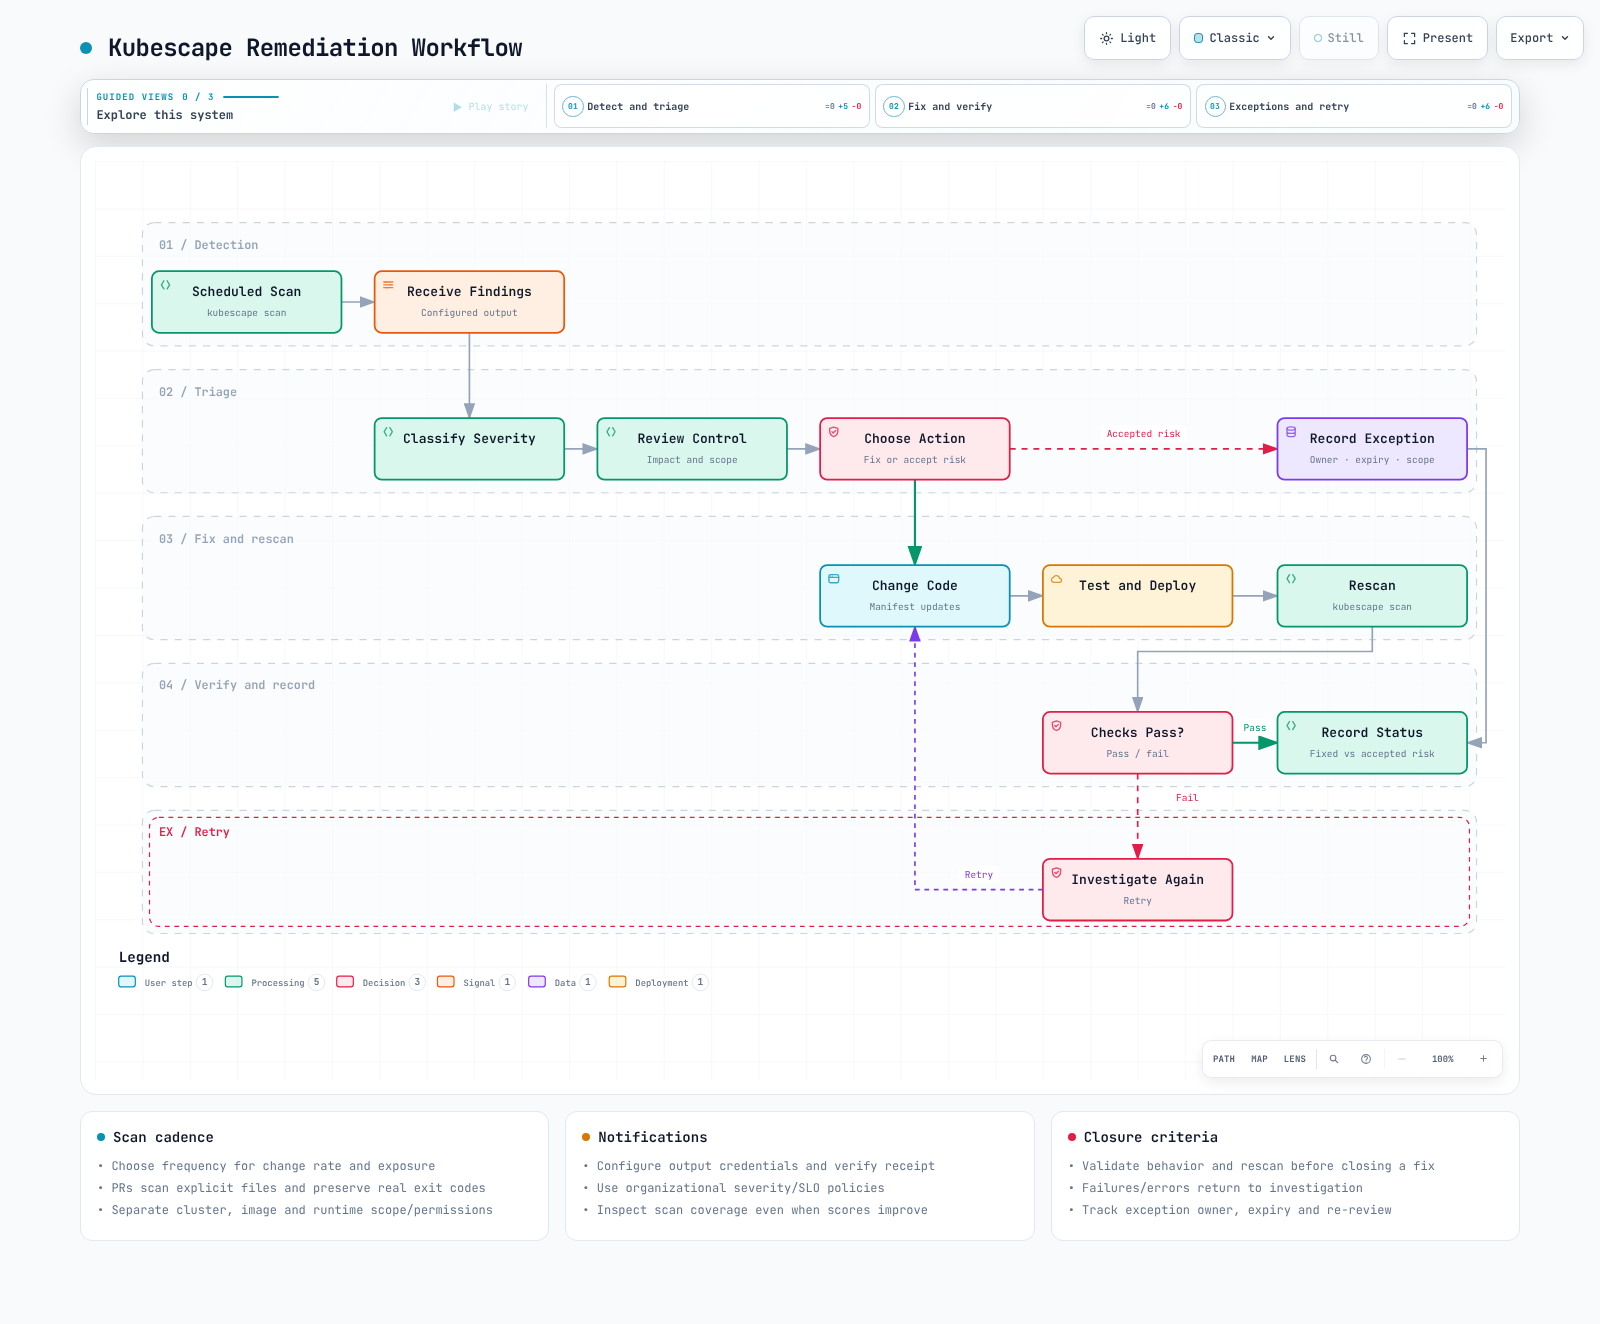
scope、pass/fail/unavailable check、policy hash、tool image、exception owner、expiry dateを記録してください。scoreは同等のinput/policy間でのみ比較してください。Node scan、image scan、runtime detectionは別個のevidence sourceです。
Prometheus Integration
apiVersion: monitoring.coreos.com/v1
kind: PodMonitor
metadata:
  name: kubescape-posture
  namespace: monitoring
spec:
  namespaceSelector:
    matchNames: [kubescape]
  selector:
    matchLabels:
      app.kubernetes.io/name: kubescape-operator
      app.kubernetes.io/instance: kubescape
      app.kubernetes.io/component: prometheus-exporter
  podMetricsEndpoints:
    - port: metrics
      path: /metrics
      interval: 60s
確認したexporter Podはcontainer port 8080をmetricsと命名していますが、そのService portには名前がありません。したがって、このexampleでは実際のPod labelと名前付きportに一致するPodMonitorを使用します。Prometheus OperatorとPrometheus PodMonitor selectionは別個の前提条件です。
実際のexporter 0.2.23のgauge例はkubescape_controls_total_cluster_highおよびkubescape_controls_total_workload_highです。_total suffixが付いていても、それらはcounterではありません。古いkubescape_compliance_score/critical_findings/last_scan_timestamp名は、確立された共通metricsではありません。missing scrapeとstale dataは別途monitorしてください。
まとめとReference
Local validationでは、binary/checksum、policy snapshot、threshold boundary/severity/deprecated gate、exception/exclusion behavior、公開済みshell gate、Helm rendering、SecurityException schema、PodMonitor targeting、GitHub Actions syntax、30件のdiagram browser caseを対象にしました。実際のAWS/Kubernetes/registry/notification/SaaS operationは実施していません。