Prometheus
最后更新: September 13, 2026. 下面描述的是本地配置/查询检查;未执行任何集群或云端部署。
目录
简介与版本
Prometheus 是最初在 SoundCloud 开发的 CNCF 监控工具集。它采集数值型时间序列,将其存储在本地 TSDB 中,评估 PromQL 以及 recording/alert 规则,并把告警发送给 Alertmanager。常规采集使用 HTTP 抓取(scraping);远程写入和可选的批处理集成提供了其他投递路径。它不是事件日志、trace 存储,也不是精确的按请求计费账本。
本地保留期(retention)可配置,并且可以超过 30 天。是否使用独立的存储,取决于保留期、容量、共享查询以及故障/恢复方面的要求。
本章使用官方 kube-prometheus-stack 90.0.0 包,发布于 2026 年 9 月 6 日。其组件版本作为一个整体组合进行了检查:
| 组件 | 包默认值 |
|---|---|
| Prometheus Operator | 0.93.1 |
| Prometheus | 3.14.0, distroless 镜像 |
| Alertmanager | 0.34.0 |
| Grafana | 13.2.1, 子 chart 13.2.2 |
| kube-state-metrics | 2.20.0, 子 chart 8.4.2 |
| node-exporter | 1.12.1, 子 chart 4.56.3 |
该 chart 的 kubeVersion 约束为 >=1.25.0-0。这并不是一份完整的兼容性矩阵,也不表示所有 Kubernetes 1.25+ 版本都仍受支持。请检查实际集群、组件支持情况、准入策略(admission policy)以及存储驱动。
该配置面向 基于 Linux EC2 的 EKS 工作节点。Fargate 没有 DaemonSet;Auto Mode、Hybrid Nodes 和 Windows 需要针对具体平台检查采集器/存储。
2026 年 7 月的历史性更新
- 7 月 14 日的 Kubernetes exporter 文章 讲解了应用埋点(instrumentation)与自定义 exporter。使用 HPA 还需要相应的 metrics API/adapter;仅靠抓取并不能把任意指标接入 HPA。
- 7 月 21 日的 AMP 公告 描述了每个 workspace 最多 15 亿个活跃序列以及 200,000 条 recording/alerting 规则。这些是公布的扩展上限,并不是自动授予的默认配额或审批保证。请检查目标 workspace/账户的当前配额。
架构与组件
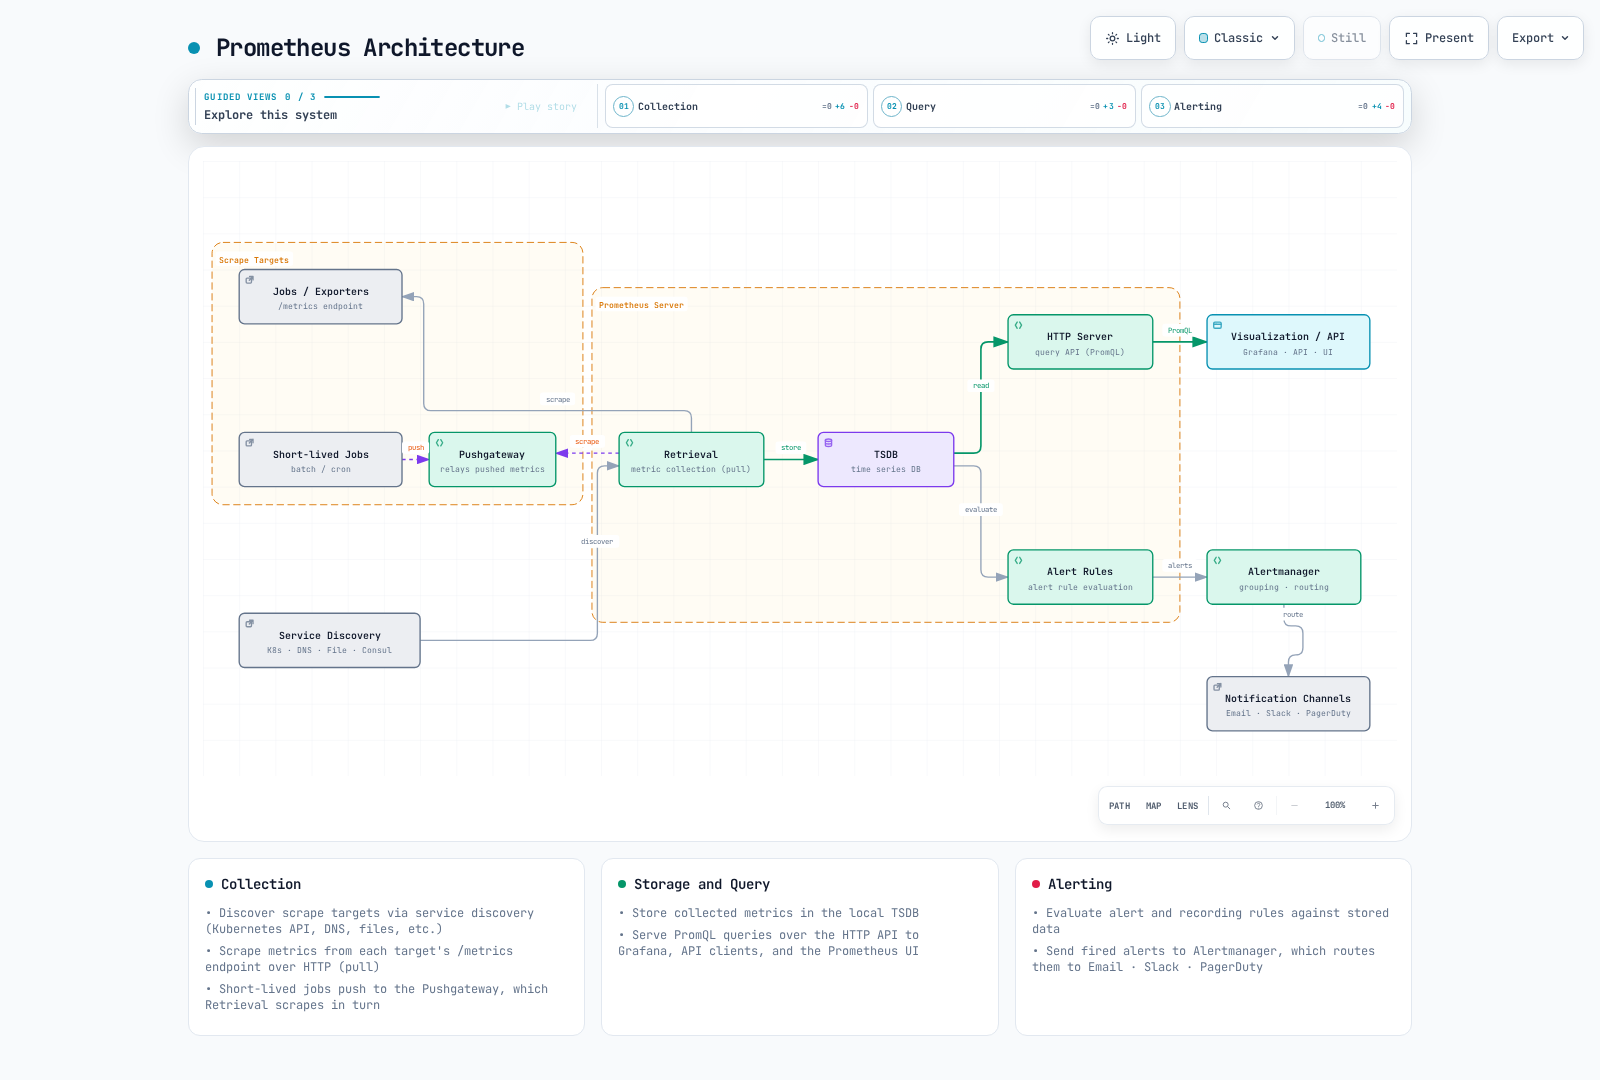
Pushgateway 分支对合适的服务级批处理作业而言是可选的,并不适用于所有短生命周期的 Pod。分组需要生命周期管理;参见 指标概览。up 报告的是抓取健康状况,而不是应用可用性。
| 组件 | 职责与前提条件 |
|---|---|
| Prometheus | 发现、抓取、本地 TSDB、查询 API 与规则评估 |
| kube-state-metrics | API 对象状态;需要 ServiceAccount、RBAC 和一个抓取端点 |
| node-exporter | 主机 OS 指标;需要审查主机访问/挂载与平台支持 |
| kubelet/cAdvisor | 容器度量;需验证服务证书、授权与端点可用性 |
| metrics-server / adapters | 供自动扩缩使用的资源/自定义指标 API;与历史 TSDB 存储无关 |
| Alertmanager | 对告警进行分组、去重、抑制并路由到配置的接收器 |
| Grafana | 查询/可视化数据源;认证与数据库/存储需要各自单独配置 |
该 chart 提供 exporter 与相关支撑资源。不完整的独立 Deployment/DaemonSet 片段无法补齐缺失的 ServiceAccount、RBAC 和 Service,也不应用来创建重复的监控栈。
TSDB 与配置层级
最近的样本位于 head/WAL 中;压缩后的 block 包含 chunk、index 与元数据。Tombstone 标记被删除的区间。WAL 重放有助于崩溃恢复,但不能替代备份,无法在卷丢失后存活,也不保证恢复每一个事件。
| 层级 | 正确的设置项 |
|---|---|
| 进程参数 | --storage.tsdb.path, --storage.tsdb.retention.time, --storage.tsdb.retention.size |
| Prometheus 配置 | global, scrape_configs, rule_files, remote_write |
Operator Prometheus.spec | retention, retentionSize, storage, replicas, shards |
| 本 chart 的 values | prometheus.prometheusSpec.retention、storageSpec 以及下文的取值 |
旧式的 storage.tsdb.path/retention.time/... YAML 并不是有效的进程配置。在 独立安装 的情况下,基本参数形如:
prometheus --config.file=prometheus.yml \
  --storage.tsdb.path=/prometheus \
  --storage.tsdb.retention.time=15d \
  --storage.tsdb.retention.size=15GB
对于 Operator 安装,请配置所属的 Helm values。保留大小并不是磁盘总量的硬性上限:要为 WAL、head、index 与压缩留出空间。使用受支持的本地/块存储;任意 NFS 并不是受支持的替代方案。
PromQL
示例假定 job="example-app" 以及该 chart 的 node-exporter/kube-state-metrics job 标签。请根据实际目标进行调整。example_queue_depth 和 temperature_celsius 是应用自定义的 Gauge,不是 Kubernetes 内置指标。
选择器、区间与速率
即时选择器(instant selector)依据回溯/过期(lookback/staleness)规则查找符合条件的样本;“当前”并不保证在评估时刻恰好有一次观测。区间选择器选取一个样本区间。子查询(subquery)按其分辨率评估表达式,而不是选取每第 N 个已存储的原始样本。
| 用途 | PromQL |
|---|---|
| 即时选择器 | http_requests_total{job="example-app"} |
| 正向/正则过滤 | http_requests_total{job="example-app",method="GET",status=~"2[0-9]{2}"} |
| 负向正则 | http_requests_total{job="example-app",status!~"5[0-9]{2}"} |
| 区间向量 | http_requests_total{job="example-app"}[5m] |
| 以五分钟分辨率的一小时子查询 | rate(http_requests_total{job="example-app"}[5m])[1h:5m] |
| 一小时前的速率窗口 | rate(http_requests_total{job="example-app"}[5m] offset 1h) |
| 每秒平均 counter 速率 | rate(http_requests_total{job="example-app"}[5m]) |
| 基于最后两个可用样本的速率 | irate(http_requests_total{job="example-app"}[5m]) |
| 外推的 counter 增量 | increase(http_requests_total{job="example-app"}[1h]) |
负向匹配器可以选中不带该标签的序列。rate() 与 increase() 会处理观测到的重置并进行外推;它们无法恢复每一个遗漏的增量。应当 先 rate 再聚合。irate() 对最新样本敏感,通常不太适合稳定的告警条件。
区间向量是区间函数的输入,而不是现成的区间查询图表。例如,需要评估后的速率序列时,请使用 rate(counter[5m])。
聚合、Gauge 与时间
| 用途 | PromQL |
|---|---|
| 按 method 统计请求速率 | sum by (method) (rate(http_requests_total{job="example-app"}[5m])) |
| 聚合掉 instance | sum without (instance) (rate(http_requests_total{job="example-app"}[5m])) |
| 对去重后的 Running 指示值求和 | sum(max by (namespace,pod,uid) (kube_pod_status_phase{job="kube-state-metrics",phase="Running"})) |
| 最大可用内存 | max(node_memory_MemAvailable_bytes{job="node-exporter"}) |
| 排除空/基础设施容器标签后的 Pod CPU Top | topk(5, sum by (namespace,pod) (rate(container_cpu_usage_seconds_total{job="kubelet",container!="",container!="POD"}[5m]))) |
| 当前队列深度 Gauge 的分位数 | quantile(0.95, example_queue_depth{job="example-app"}) |
| 速率的标准差 | stddev(rate(http_requests_total{job="example-app"}[5m])) |
| 外推的 Gauge 变化量 | delta(temperature_celsius{job="example-app"}[1h]) |
| Gauge 每秒斜率 | deriv(temperature_celsius{job="example-app"}[1h]) |
| 与 20°C 的绝对偏差 | abs(temperature_celsius{job="example-app"} - 20) |
| 向上取整 | ceil(example_queue_depth{job="example-app"}) |
| 限制到某个区间 | clamp(example_queue_depth{job="example-app"}, 0, 100) |
| 平方根 | sqrt(example_queue_depth{job="example-app"}) |
| 自然对数 | ln(example_queue_depth{job="example-app"}) |
| 以 Unix 秒表示的评估时间 | time() |
| 所选样本的时间戳 | timestamp(up{job="example-app"}) |
| 样本的 UTC 小时 | hour(timestamp(up{job="example-app"})) |
对 kube_pod_status_phase{phase="Running"} 序列计数会把值为 0 的序列也计入。在去除重复的 exporter 身份后再对 0/1 指示值求和,当只存在 0 指示值时结果为 0,而缺失的遥测数据仍然缺失。
Gauge 的 quantile() 示例是在多个序列的取值之间比较。它并不计算 histogram 的请求延迟 p95,也不会合并 Summary 的 p99 值。数学函数存在输入定义域限制;例如非正数的对数需要刻意处理。相关函数包括 floor、round、clamp_min 与 clamp_max。
下面这个工作时段过滤条件基于 UTC,而不是浏览器/集群时区:
sum(rate(http_requests_total{job="example-app"}[5m])) and on() (hour() >= 9 < 18)分布与预测
histogram_quantile(0.95, sum by (le) (rate(http_request_duration_seconds_bucket{job="example-app"}[5m])))histogram_quantile(0.99, sum by (le,method) (rate(http_request_duration_seconds_bucket{job="example-app"}[5m])))sum(rate(http_request_duration_seconds_sum{job="example-app"}[5m])) / sum(rate(http_request_duration_seconds_count{job="example-app"}[5m]))聚合兼容的经典 bucket 并保留 le。分位数在 bucket 内部通过插值得到。Summary 的分位数同样是近似值,无法通过求平均得到整个集群的百分位;sum/count 可以计算整体均值。
predict_linear() 会对拟合出的 Gauge 趋势做外推。负值预测是需要排查的理由,而不是未来磁盘一定会耗尽的保证:
predict_linear(node_filesystem_avail_bytes{job="node-exporter",mountpoint="/",fstype!~"tmpfs|overlay"}[6h], 86400)Prometheus 3 将 holt_winters 更名为 double_exponential_smoothing。这是 Holt 线性平滑,而不是带季节性的三次指数预测,并且需要 Gauge 浮点样本。可选表达式:double_exponential_smoothing(example_queue_depth{job="example-app"}[1h], 0.5, 0.5)。执行评估的服务器需要 --enable-feature=promql-experimental-functions。本地审查只检查了其解析器语法;并不声称实验性函数的取值评估已通过验证。
运维示例
| 用途 | PromQL |
|---|---|
| CPU 非空闲百分比 | 100 * (1 - avg by (instance) (rate(node_cpu_seconds_total{job="node-exporter",mode="idle"}[5m]))) |
| 未被报告为 MemAvailable 的比例 | 100 * (1 - node_memory_MemAvailable_bytes{job="node-exporter"} / node_memory_MemTotal_bytes{job="node-exporter"}) |
| 估算的重启增量超过 3 次 | increase(kube_pod_container_status_restarts_total{job="kube-state-metrics"}[1h]) > 3 |
| 文件系统不可用空间百分比 | 100 * (1 - node_filesystem_avail_bytes{job="node-exporter",mountpoint="/"} / node_filesystem_size_bytes{job="node-exporter",mountpoint="/"}) |
| 每秒接收 + 发送字节数 | rate(node_network_receive_bytes_total{job="node-exporter",device="eth0"}[5m]) + rate(node_network_transmit_bytes_total{job="node-exporter",device="eth0"}[5m]) |
对于错误百分比,健康的服务可能完全没有 5xx 序列。下面的零值兜底只用于匹配存在总流量的分组;它不会为缺失的服务凭空造出健康数据。
100 * (sum by (namespace, service) (rate(http_requests_total{job="example-app",status=~"5[0-9]{2}"}[5m])) or on (namespace, service) (0 * (sum by (namespace, service) (rate(http_requests_total{job="example-app"}[5m]))))) / (sum by (namespace, service) (rate(http_requests_total{job="example-app"}[5m])))观测到健康流量时结果为 0,全部为 5xx 时结果为 100,分母为零时结果仍然未定义。缺失的遥测数据依旧缺失;请单独监控采集失败。
发现机制与 Operator 选择器
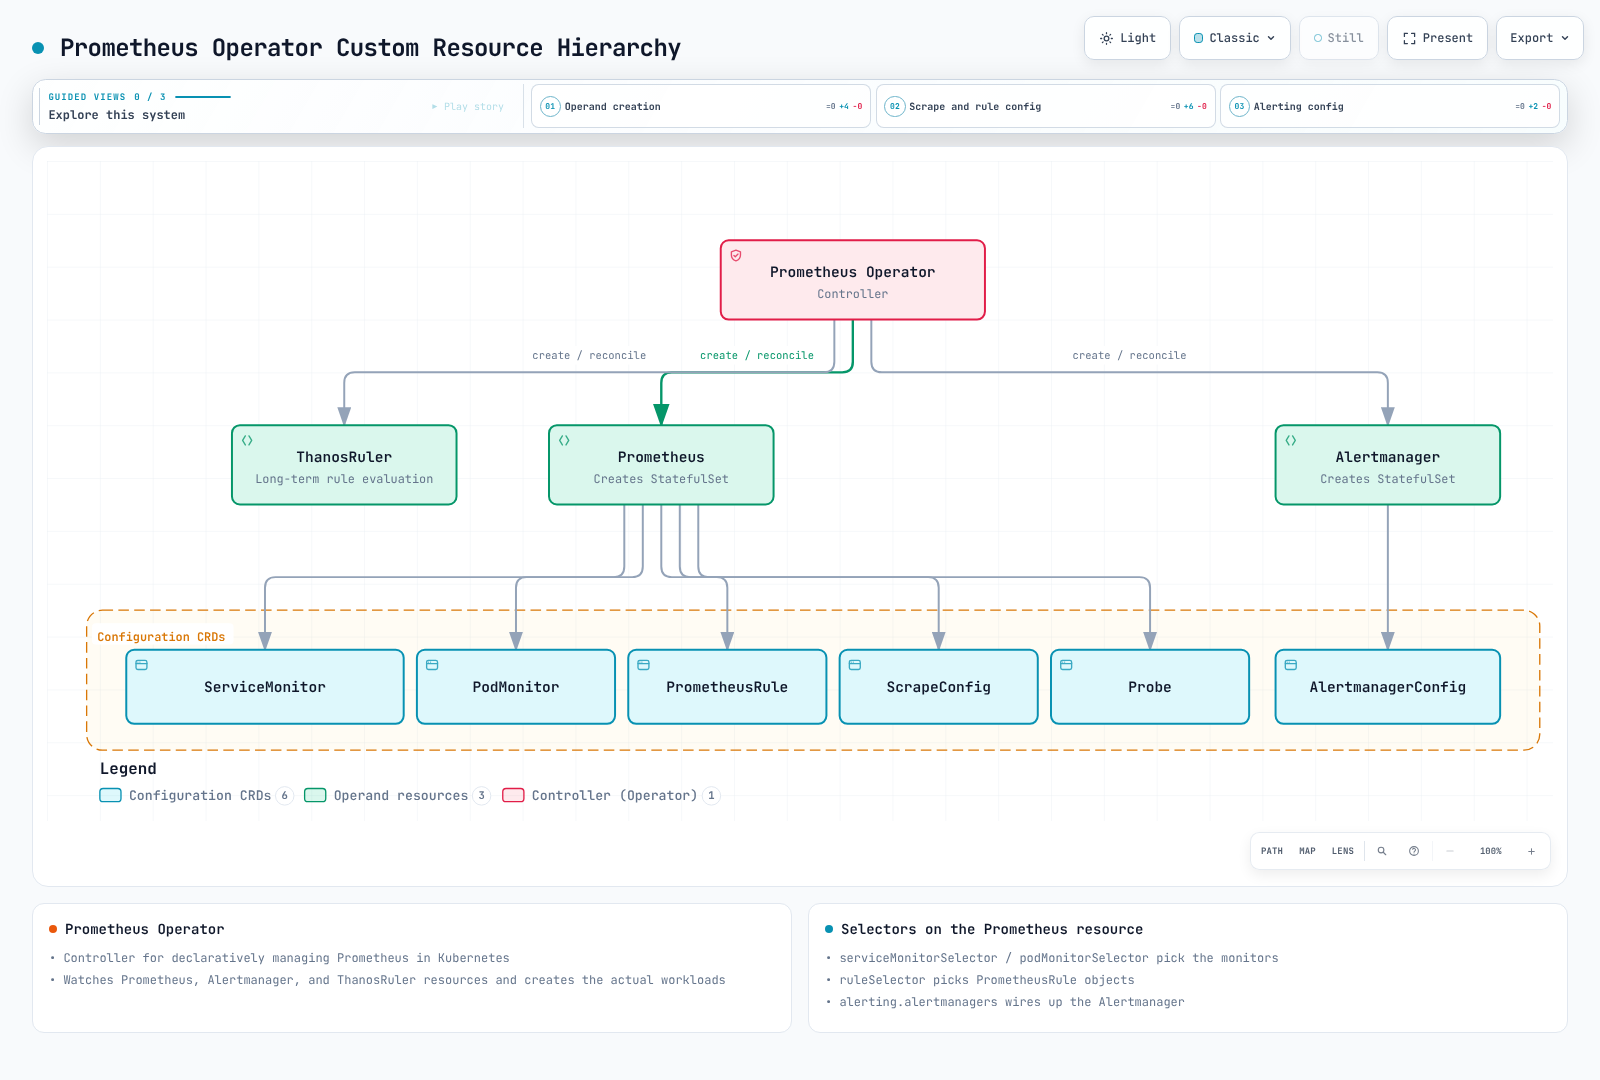
图中的 Prometheus/Alertmanager 节点指的是 自定义资源(custom resource)。Operator 读取它们,并协调(reconcile)实际的工作负载,例如 StatefulSet。这些对象或 Prometheus 服务器本身不会独立创建 StatefulSet。
| 选择阶段 | 被选中的对象 |
|---|---|
Prometheus serviceMonitorNamespaceSelector | 包含 ServiceMonitor 对象的 Namespace |
Prometheus serviceMonitorSelector | 这些 ServiceMonitor 对象上的标签 |
ServiceMonitor namespaceSelector / selector | 目标 Service 的 Namespace 与标签 |
ServiceMonitor endpoint port | Service 端口名称,而不是任意容器端口号 |
PodMonitor selector / endpoint port | Pod 标签与声明的容器端口名称 |
RBAC、发现机制以及网络/TLS 访问是彼此独立的要求。选择器不能替代授权。Helm 的 *SelectorNilUsesHelmValues 布尔值影响的是标签选择器的默认值,而不是所有目标 Namespace。
一个完整可用的应用抓取示例
假定 example-app 中已存在一个完成埋点的 Deployment,Pod 标签为 app: example-app,并声明了名为 metrics 的端口对外提供 /metrics。下面的 Service 并不会创建该应用:
# service.yaml
apiVersion: v1
kind: Service
metadata:
  name: example-app
  namespace: example-app
  labels:
    app: example-app
    metrics-job: example-app
spec:
  selector:
    app: example-app
  ports:
  - name: http-metrics
    port: 8080
targetPort: metrics# servicemonitor.yaml
apiVersion: monitoring.coreos.com/v1
kind: ServiceMonitor
metadata:
name: example-app
namespace: monitoring
labels:
release: kube-prom
spec:
jobLabel: metrics-job
selector:
matchLabels:
app: example-app
namespaceSelector:
matchNames:
- example-app
endpoints:
- port: http-metrics
path: /metrics
interval: 30s
scrapeTimeout: 10s
relabelings:
- sourceLabels:
- __meta_kubernetes_service_name
targetLabel: service
- sourceLabels:
- __meta_kubernetes_namespace
targetLabel: namespace
- sourceLabels:
- __meta_kubernetes_pod_name
targetLabel: podServiceMonitor 的 release: kube-prom 与该安装相匹配。它的 jobLabel 读取 Service 上的 metrics-job: example-app,从而确定应用查询所用的 job 标签。
PodMonitor 是针对同一批 Pod 的 替代方案。对同一个端点只选择一条预期的采集路径,以避免重复摄入:
# podmonitor.yaml
apiVersion: monitoring.coreos.com/v1
kind: PodMonitor
metadata:
  name: example-app-pods
  namespace: monitoring
  labels:
    release: kube-prom
spec:
  selector:
    matchLabels:
      app: example-app
  namespaceSelector:
    matchNames:
    - example-app
  podMetricsEndpoints:
  - port: metrics
    interval: 30s
    path: /metrics
    relabelings:
    - targetLabel: job
      replacement: example-app
    - targetLabel: service
      replacement: example-app
其他发现路径
- 独立部署/agent 模式的 Pod 发现可以使用 概览中的命名端口配置,它会保留发现机制提供的 IPv4/IPv6 地址。类似
prometheus.io/scheme的注解只有在实际配置真正消费它时才会生效。 - 对服务做 blackbox 探测需要安装 exporter、定义探测模块、设置合适的目标 URL/scheme,以及
Probe/抓取配置。up描述的是对 exporter 的抓取;探测成功与否是另一个独立信号。 - 节点发现到达的是 kubelet 端点,并不会自动指向 node-exporter。请验证服务证书、正确的 CA 以及节点指标相关的 RBAC。Kubernetes API 的 CA 并不能证明对任意节点证书的信任。
- 使用经过审查的 namespace/service/team 标签,而不是不加限制的节点
labelmap。移除身份标签并不是一种聚合操作。
kube-prometheus-stack 安装
以下是会改变集群状态的运维命令,并非本次审查中执行过的命令。请使用预期的 context 与你自己拥有的 release。对于已有安装,应审查实际的 values、CRD、存储与升级说明,而不要再安装一套重复的栈。
该配置的前提条件:
- 已获授权的 Helm/Kubernetes 访问权限,以及充足的 Linux EC2 节点资源。
- 可用的默认块存储 StorageClass/CSI 驱动,或者为每个 PVC 明确指定经过审查的 class 名称。并不保证
gp3一定存在。 - 已存在
monitoringnamespace,且 Linux EC2 节点上已部署 Secrets Store CSI driver 与 AWS provider(ASCP)。在 AWS Secrets Manager(ap-northeast-2)中准备observability/grafana-admin,其 JSON 字符串键为admin-password;不要将其同步到 Kubernetes Secret 中。 metrics-demo-grafana服务账户需要一个针对该 secret 的最小权限 IRSA 角色。请替换下面示例中的 IAM 角色 ARN,并应用相匹配的 SecretProviderClass。参见 完整的身份、KMS、挂载与轮换前提条件。- 已验证的 kubelet TLS 信任链。该配置启用证书校验;如果证书由其他颁发者签发,应提供正确的 CA,而不是绕过校验。
容量规格仅作示意。每个 Prometheus 副本都有自己的 PVC;保留大小并不限制 WAL/head/压缩所占用的空间。Grafana 保持为一个副本,并使用 PVC 支撑的数据库。仅增加副本数并不等于共享数据库的 HA。
# kube-prometheus-stack 90.0.0; replace the example IRSA role ARN before use.
fullnameOverride: metrics-demo
kubeControllerManager:
  enabled: false
kubeScheduler:
  enabled: false
kubeEtcd:
  enabled: false
kubeProxy:
  enabled: false
kubelet:
  serviceMonitor:
    tlsConfig:
      insecureSkipVerify: false
prometheus:
  serviceAccount:
    create: true
    name: metrics-demo-prometheus
  prometheusSpec:
    replicas: 1
    shards: 1
    retention: 15d
    retentionSize: 15GB
    storageSpec:
      volumeClaimTemplate:
        spec:
          accessModes:
          - ReadWriteOnce
          resources:
            requests:
              storage: 20Gi
    resources:
      requests:
        cpu: 500m
        memory: 2Gi
      limits:
        memory: 4Gi
    externalLabels:
      cluster: eks-metrics-demo
    serviceMonitorSelectorNilUsesHelmValues: true
    serviceMonitorNamespaceSelector: &id001
      matchExpressions:
      - key: kubernetes.io/metadata.name
        operator: In
        values:
        - monitoring
        - example-app
    podMonitorSelectorNilUsesHelmValues: true
    podMonitorNamespaceSelector: *id001
    ruleSelectorNilUsesHelmValues: true
    ruleNamespaceSelector:
      matchLabels:
        kubernetes.io/metadata.name: monitoring
alertmanager:
  alertmanagerSpec:
    replicas: 1
    storage:
      volumeClaimTemplate:
        spec:
          accessModes:
          - ReadWriteOnce
          resources:
            requests:
              storage: 5Gi
grafana:
  fullnameOverride: metrics-demo-grafana
  replicas: 1
  persistence:
    enabled: true
    size: 10Gi
  sidecar:
    dashboards:
      searchNamespace: monitoring
      skipReload: true
      initDashboards: true
      provider:
        updateIntervalSeconds: 30
    datasources:
      searchNamespace: monitoring
      skipReload: true
      initDatasources: true
  serviceAccount:
    create: true
    name: metrics-demo-grafana
    annotations:
      eks.amazonaws.com/role-arn: arn:aws:iam::111122223333:role/metrics-grafana-secrets
  env:
    GF_SECURITY_ADMIN_USER: admin
    GF_SECURITY_ADMIN_PASSWORD: $__file{/mnt/grafana-secrets/admin-password}
  grafana.ini:
    security:
      admin_user: admin
      admin_password: $__file{/mnt/grafana-secrets/admin-password}
  extraVolumes:
  - name: grafana-secrets
    csi:
      driver: secrets-store.csi.k8s.io
      readOnly: true
      volumeAttributes:
        secretProviderClass: metrics-grafana-admin
  extraVolumeMounts:
  - name: grafana-secrets
    mountPath: /mnt/grafana-secrets
    readOnly: true
该 EKS 配置禁用了针对托管控制平面组件的 monitor,以及本文并不假定其已暴露的 kube-proxy 端点。这并不是禁用 Kubernetes 本身。monitoring/example-app 中的 ServiceMonitor 需要匹配的 release 标签;规则从 monitoring 中选取。
Grafana 在 GF_SECURITY_ADMIN_PASSWORD 中收到的是一个 字面的文件 provider 表达式,而不是密码值。这会抑制 chart 自动生成的凭据环境变量引用。Grafana 13.2.1 会在环境变量覆盖之后,于其配置内部求值 $__file{...};没有 __FILE 入口点或 shell 会导出文件内容。只读的 CSI 文件必须能被 UID/GID 472 读取(fsGroup: 472,权限 0440),并且只有 Grafana 主容器挂载它。请使用不含首尾空白字符的密码,因为文件 provider 会做去空白处理。
dashboard/datasource 的 init 容器会在启动前填充 provisioning 文件。Sidecar 会持续监视文件,但设置了 skipReload: true,因此都不需要管理员凭据。Grafana 每 30 秒轮询一次 dashboard 文件;datasource 更新需要一次受控的 Pod 重启。admin_password 只在初始化新数据库时生效:修改 AWS secret、CSI 轮换或重启都不会重置已有 PVC/数据库中的管理员密码。请使用经批准的密码变更/SSO 流程,并同步该 secret;保留 PVC。
请使用完整的 可复用配置,其中包含 grafana-secret-provider.yaml。本地渲染/测试覆盖的是配置与挂载,而不是真实的 CSI 权限、登录或轮换。主要依据的契约:Grafana 配置 与 AWS ASCP。
在仓库根目录下,准备好前提条件后执行一次安装:
PROFILE=examples/observability/secret-profiles
kubectl apply -f "$PROFILE/grafana-secret-provider.yaml"
helm repo add prometheus-community https://prometheus-community.github.io/helm-charts
helm repo update prometheus-community
helm template kube-prom prometheus-community/kube-prometheus-stack \
  --version 90.0.0 --namespace monitoring -f "$PROFILE/prometheus-values.yaml" \
  > grafana-reviewed-render.yaml
# Review resources, prerequisites and ownership before this cluster-changing command.
helm upgrade --install kube-prom prometheus-community/kube-prometheus-stack \
  --version 90.0.0 --namespace monitoring -f "$PROFILE/prometheus-values.yaml" \
  --wait --timeout 15m
检查 CRD 是否建立、Operator 是否健康、PVC 是否绑定以及实际的抓取目标。只有在相关 CRD 建立之后,再应用所选的应用 monitor/规则。
Chart 的 CRD 升级处理方式与版本相关。请阅读升级说明,不要假定普通的 Helm upgrade 就能覆盖所有 CRD 迁移。Chart 90 还将 Grafana 依赖切换到社区仓库;升级时请校验现有的认证/provisioning values,并保留数据库/PVC 备份。
规则与 Alertmanager
下面选中的 PrometheusRule 包含 alert 与 recording 示例。CPU 的 recording 规则一致地使用 rate 与比率单位。错误率表达式是百分比,因此阈值为 1,注解中打印的也是百分比。
# prometheusrule.yaml
apiVersion: monitoring.coreos.com/v1
kind: PrometheusRule
metadata:
  name: example-rules
  namespace: monitoring
  labels:
    release: kube-prom
spec:
  groups:
  - name: example-alerts
    interval: 30s
    rules:
    - alert: NodeMemoryHigh
      expr: 100 * (1 - node_memory_MemAvailable_bytes{job="node-exporter"} / node_memory_MemTotal_bytes{job="node-exporter"})
        > 90
      for: 5m
      labels:
        severity: warning
        team: infrastructure
      annotations:
        summary: Node {{ $labels.instance }} memory availability is low
        description: '{{ printf "%.2f" $value }}% is not reported as MemAvailable.'
    - alert: PodRestartingFrequently
      expr: increase(kube_pod_container_status_restarts_total{job="kube-state-metrics"}[1h]) > 5
      for: 10m
      labels:
        severity: warning
      annotations:
        summary: Pod {{ $labels.namespace }}/{{ $labels.pod }} is restarting
        description: '{{ printf "%.2f" $value }} estimated restarts in one hour.'
    - alert: ProjectedDiskExhaustion
      expr: predict_linear(node_filesystem_avail_bytes{job="node-exporter",mountpoint="/",fstype!~"tmpfs|overlay"}[6h],
        86400) < 0
      for: 1h
      labels:
        severity: warning
      annotations:
        summary: Projected disk exhaustion on {{ $labels.instance }}
        description: The fitted six-hour trend projects negative free space in 24 hours; inspect the filesystem
          and workload.
    - alert: HighErrorRate
      expr: (100 * (sum by (namespace, service) (rate(http_requests_total{job="example-app",status=~"5[0-9]{2}"}[5m]))
        or on (namespace, service) (0 * (sum by (namespace, service) (rate(http_requests_total{job="example-app"}[5m])))))
        / (sum by (namespace, service) (rate(http_requests_total{job="example-app"}[5m])))) > 1
      for: 5m
      labels:
        severity: warning
        team: backend
      annotations:
        summary: High error rate on {{ $labels.namespace }}/{{ $labels.service }}
        description: '{{ printf "%.2f" $value }}% of requests are 5xx, above the 1% threshold.'
  - name: example-recording
    rules:
    - record: instance:node_cpu_utilization:ratio_rate5m
      expr: 100 * (1 - avg by (instance) (rate(node_cpu_seconds_total{job="node-exporter",mode="idle"}[5m])))
        / 100
    - record: instance:node_memory_not_available:ratio
      expr: max by (instance) ((1 - node_memory_MemAvailable_bytes{job="node-exporter"} / node_memory_MemTotal_bytes{job="node-exporter"}))
for 表示同一组告警标签必须在连续多次评估中持续满足表达式,之后才会触发(firing)。数据缺失或标签变化会中断 pending 状态。它不是 Alertmanager 的通知延迟或重复间隔。预测类告警描述的是一种推测,而不是必然发生的故障。
AlertmanagerConfig 与 namespace 边界
Operator 0.93.1 打包的 AlertmanagerConfig CRD 提供 v1alpha1。本示例把它作为管理员拥有的 全局配置 使用。被引用的 Secret 必须存在于 monitoring 中。在启用投递之前,请替换/审批其中的地址、频道与 provider 目标。
Operator API 将 alertmanagerConfiguration 标记为实验性:请保持版本边界并测试升级。普通的、被选中的 namespaced AlertmanagerConfig 通常会被加上 namespace 匹配器;位于 monitoring 的配置不会自动接收所有 namespace 的应用告警。而全局配置是有意具有更宽的管理边界。
# alertmanagerconfig.yaml
apiVersion: monitoring.coreos.com/v1alpha1
kind: AlertmanagerConfig
metadata:
  name: main-config
  namespace: monitoring
spec:
  route:
    receiver: default
    groupBy:
    - alertname
    - namespace
    - severity
    groupWait: 30s
    groupInterval: 5m
    repeatInterval: 4h
    routes:
    - receiver: pagerduty-critical
      matchers:
      - name: severity
        matchType: '='
        value: critical
      groupWait: 10s
      repeatInterval: 1h
    - receiver: slack-backend
      matchers:
      - name: team
        matchType: '='
        value: backend
    - receiver: slack-warnings
      matchers:
      - name: severity
        matchType: '='
        value: warning
      groupWait: 1m
  inhibitRules:
  - sourceMatch:
    - name: severity
      matchType: '='
      value: critical
    targetMatch:
    - name: severity
      matchType: '='
      value: warning
    equal:
    - alertname
    - cluster
    - namespace
    - service
    - instance
    - pod
    - container
  receivers:
  - name: default
    emailConfigs:
    - to: alerts@example.com
      from: alertmanager@example.com
      smarthost: smtp.example.com:587
      authUsername: alertmanager
      authPassword:
        name: alertmanager-smtp
        key: password
      requireTLS: true
  - name: slack-backend
    slackConfigs:
    - apiURL:
        name: alertmanager-slack
        key: webhook-url
      channel: '#team-backend-alerts'
      sendResolved: true
  - name: slack-warnings
    slackConfigs:
    - apiURL:
        name: alertmanager-slack
        key: webhook-url
      channel: '#alerts'
      sendResolved: true
  - name: pagerduty-critical
    pagerdutyConfigs:
    - routingKey:
        name: alertmanager-pagerduty
        key: routing-key
      sendResolved: true
默认情况下,同级路由在第一次匹配后就停止。critical 路由排在最前;backend 路由位于通用 warning 路由之前,这样它才可能被匹配到。只有确实需要多路投递时,才有意识地设置 continue。抑制规则同时匹配资源身份与告警名称:某个服务/节点的 critical 告警不应压制一个无关的 warning。为你的告警族选择有意义的 equal 标签字段;两个告警中都不存在的标签会被视为相等。
CR 中的 groupBy 在原生 Alertmanager 配置中对应 group_by。分组控制通知批次;它与对相同告警去重不是一回事。groupWait、groupInterval 与 repeatInterval 控制通知时序,与 PrometheusRule 的 for 相互独立。
创建好被引用的 Secret 与 AlertmanagerConfig 之后,把这份附加的 values 文件合并到 同一个 固定版本的 release 中:
# alerting-values.yaml
alertmanager:
  alertmanagerSpec:
    alertmanagerConfiguration:
name: main-confighelm upgrade --install kube-prom prometheus-community/kube-prometheus-stack \
--version 90.0.0 --namespace monitoring \
-f values.yaml -f alerting-values.yaml --wait --timeout 15m原生路由检查使用了接收器名称,但没有实际发送通知。Secret 获取、provider 认证以及真实的通知投递仍需要受控验证。
远程写入与 AMP
远程写入会异步地把样本转发给配置的后端。它不投递告警,不保证无限缓冲,也不能替代备份。请监控积压(backlog)、重试与接收端限制。除非有经过审查的聚合/丢弃策略明确了其后果,否则应保留完整的 histogram 分布。
权限受限的 AMP 摄入
下面的账户与 workspace 标识符是 虚构的占位符。请在端点、IAM 资源与角色注解中一致地替换为经批准的 Region/账户/workspace。摄入角色只需要对该 workspace 拥有 aps:RemoteWrite;查询权限应属于相应的查询客户端,不会自动授予采集器。
{
  "Version": "2012-10-17",
  "Statement": [
    {
      "Effect": "Allow",
      "Action": "aps:RemoteWrite",
      "Resource": "arn:aws:aps:ap-northeast-2:111122223333:workspace/ws-11111111-1111-4111-8111-111111111111"
    }
  ]
}
请通过环境中已有的 IaC 归属方来创建/管理该角色。对于 IRSA 示例,其信任关系必须引用目标集群的 IAM OIDC provider,并同时要求 audience 为 sts.amazonaws.com、subject 为 system:serviceaccount:monitoring:metrics-demo-prometheus。仅有一个 OIDC issuer URL 并不能证明 IAM provider/信任关系已经存在。
本配置中的 ServiceAccount 与注解由 Helm 拥有。避免再通过第二个归属方创建同一个 ServiceAccount。如果复用已有账户,请理清归属关系以及 chart 的 create 设置。EKS Pod Identity 是另一种凭据下发设计;请单独配置并验证它,不要混用互不兼容的假设。
# amp-values.yaml
prometheus:
  serviceAccount:
    create: true
    name: metrics-demo-prometheus
    annotations:
      eks.amazonaws.com/role-arn: arn:aws:iam::111122223333:role/metrics-prometheus-amp
  prometheusSpec:
    replicas: 2
    shards: 1
    podAntiAffinity: hard
    podAntiAffinityTopologyKey: kubernetes.io/hostname
    replicaExternalLabelName: __replica__
    externalLabels:
      cluster: eks-metrics-demo
    remoteWrite:
    - url: https://aps-workspaces.ap-northeast-2.amazonaws.com/workspaces/ws-11111111-1111-4111-8111-111111111111/api/v1/remote_write
      sigv4:
        region: ap-northeast-2
      queueConfig:
        capacity: 10000
        maxSamplesPerSend: 2000
        maxShards: 10
在完成身份/workspace 验证之后,把这个可选的 AMP 文件与基础 values 合并到同一个 release 中。两个副本配合硬性节点反亲和性,需要至少两个合适的节点以及可用的按副本 PVC。
AMP 的 HA 去重依赖 cluster 与 __replica__。Operator 的 replicaExternalLabelName 提供其受支持的按 Pod 身份标识;手写的额外副本标签并不能替代它。请检查现有指标标签是否与 HA 标签冲突。
本示例特意使用 shards: 1。分片(sharding)划分目标集合;复制(replication)复制同一个目标集合。如果引入分片,每个分片的 HA 副本组都需要独立的去重身份以及完整的查询设计。不要把彼此独立的分片放在同一个 HA 身份下,还假定不会丢数据。
这些查询描述的是单个本地集群。跨集群的中心化/AMP 查询必须包含预期的集群范围,或显式进行聚合。
其他接收端
VictoriaMetrics 单节点通常在其配置的 HTTP 端口上接受 /api/v1/write。集群版的 vminsert 端点使用 /insert/<tenant>/prometheus/api/v1/write;必须由 vmauth 或其他经批准的访问层提供预期的路由/认证。Tenant ID 不是凭据。Mimir 及其他接收端有各自的 URL、身份与 HA 契约。
不要照搬那条丢弃所有亚秒级 histogram bucket 或整个控制平面延迟指标族的旧规则,除非评估过由此造成的分位数/SLO 损失。队列的默认值只是一个起点,而不是经过实测的生产最优值。
性能、HA 与故障排查
依据实测数据调优
Head 序列/chunk 数量、基数变动(cardinality churn)、抓取负载与并发查询都会影响内存。缩短历史保留期并不是解决活跃 head 或查询 OOM 的通用方案。在修改 limits 之前,请先检查实际使用量与查询负载。
下面这份可选的 values 片段用于说明查询限制,并不是容量建议:
# tuning-values.yaml
prometheus:
  prometheusSpec:
    query:
      maxConcurrency: 10
      maxSamples: 50000000
      timeout: 2m
更长的超时或更大的 maxSamples 会增加资源暴露风险。在同时提高这两个上限之前,请先检查开销大的表达式、区间、聚合与 recording 规则。
对于 独立 的抓取配置,下面的示例限制了一个 job,并丢弃了一个经过审查的调试指标族:
# scrape-limits.yaml
scrape_configs:
- job_name: example-app
  scrape_interval: 30s
  scrape_timeout: 10s
  sample_limit: 10000
  static_configs:
  - targets:
    - example-app.example-app.svc:8080
  metric_relabel_configs:
  - source_labels:
    - __name__
    regex: example_debug_payload_total
    action: drop
sample_limit 是在指标 relabel 之后生效的抓取接受上限。超过该值会导致本次抓取失败;它不会把端点整齐地截断为 10,000 个样本。更长的抓取间隔会降低分辨率并延缓问题发现,而移除所有 go_.*/process_.* 指标会丢失运行时诊断信息。
labeldrop 可能把原本不同的样本折叠到同一个序列上;它不会对它们求和。在移除身份标签之前,请保持唯一性并评估对接收端/基数的影响。把基数查询限定在预期的 job 范围内:
topk(10, count by (__name__) ({job="example-app"}))不要把不受支持的 TSDB 参数或字符串形式的 additionalArgs 照搬进 Operator CR。它的 additionalArgs 使用具名的参数对象,而且 CR schema 合法并不证明所选 Prometheus 二进制中存在该参数。没有针对具体版本的证据时,请避免覆盖内部的 block/chunk 行为。
HA 的边界
Prometheus 的 replicas 与 shards 都会成倍增加 Pod 数量,但解决的是不同的问题。反亲和性需要足够的节点;可用区级别的韧性还需要合适的调度与存储。查询单个分片无法得到全部目标的数据。
采集器的 HA 并不会自动让 Alertmanager、Grafana、PVC 或远程存储也具备高可用。Alertmanager 副本需要可用的 peer 连通性以及独立的调度/存储;Grafana 的 HA 需要合适的共享数据库/认证设计。请保持接收端特定的去重标签与告警身份一致。
从自己拥有的 release 出发排查
请核实 context、release 身份与生成的资源名称。这些名称对应示例中的 fullnameOverride: metrics-demo,并不适用于所有 chart 安装:
kubectl config current-context
helm status kube-prom --namespace monitoring
kubectl get prometheus,alertmanager,servicemonitor,podmonitor,prometheusrule \
  --namespace monitoring
kubectl get pods,pvc --namespace monitoring
kubectl get pods --namespace monitoring -l app.kubernetes.io/name=prometheus -o wide
kubectl top pod --namespace monitoring
kubectl top 需要可用的 Resource Metrics API。它并不能度量导致 Prometheus 内存压力的所有原因。
如需检查私有 API,请把 port-forward 绑定到回环地址,并让该进程在另一个终端中保持运行:
kubectl port-forward --namespace monitoring --address 127.0.0.1 \
service/metrics-demo-prometheus 9090:9090curl --fail --silent --show-error --max-time 10 \
http://127.0.0.1:9090/api/v1/targets \
| jq '.data.activeTargets[] | select(.health != "up") | {labels, scrapeUrl, lastError}'
curl --fail --silent --show-error --max-time 10 http://127.0.0.1:9090/api/v1/status/tsdb
curl --fail --silent --show-error --max-time 10 http://127.0.0.1:9090/api/v1/status/flags
curl --fail --silent --show-error --max-time 10 http://127.0.0.1:9090/api/v1/status/runtimeinfo
curl --fail --silent --show-error --max-time 10 http://127.0.0.1:9090/api/v1/rules
curl --fail --silent --show-error --max-time 10 http://127.0.0.1:9090/api/v1/alerts| 症状 | 修改资源之前应检查的内容 |
|---|---|
| OOMKilled | 容器 limit、head 序列/变动、查询并发/区间、样本量与负载峰值 |
| PVC Pending | 实际的 StorageClass/CSI 可用性、访问模式、容量与可用区调度 |
| 目标缺失 | 两类 monitor 选择器、namespace 选择、Service 标签/端口、Pod 标签与 Operator 协调 |
| 目标 down | 目标 URL、CA/SAN/认证、RBAC/网络路径与端点响应;报错并不等于不存在的证据 |
| 无通知 | 规则状态、标签稳定性、被选中的/全局配置、namespace 强制、路由顺序/抑制、Secret 与 provider 状态 |
| 远程写入积压 | 凭据/Region/workspace、接收端错误/配额、队列/WAL 容量与重复标签契约 |
distroless 的 Prometheus 镜像并不保证包含 shell、wget 或 curl;不要假定 kubectl exec ... wget 可用。从 Pod 网络上下文进行测试时,请使用经批准的诊断工具。把配置/目标/日志输出视为运维数据,避免公开敏感端点或凭据。
验证与参考资料
本地审查渲染了固定版本的 Helm 基础/告警/AMP 配置,校验了已发布的 CRD 结构,在合成样本上评估了核心 PromQL/规则,并检查了原生 Alertmanager 路由。未执行发现机制、准入/CEL、存储绑定、IAM 强制、外部 secret 与通知投递。实验性平滑函数只做了解析器层面的验证;即使启用了特性开关,其取值 fixture 也未被已发布的 promtool 测试引擎接受。